Fig. 20
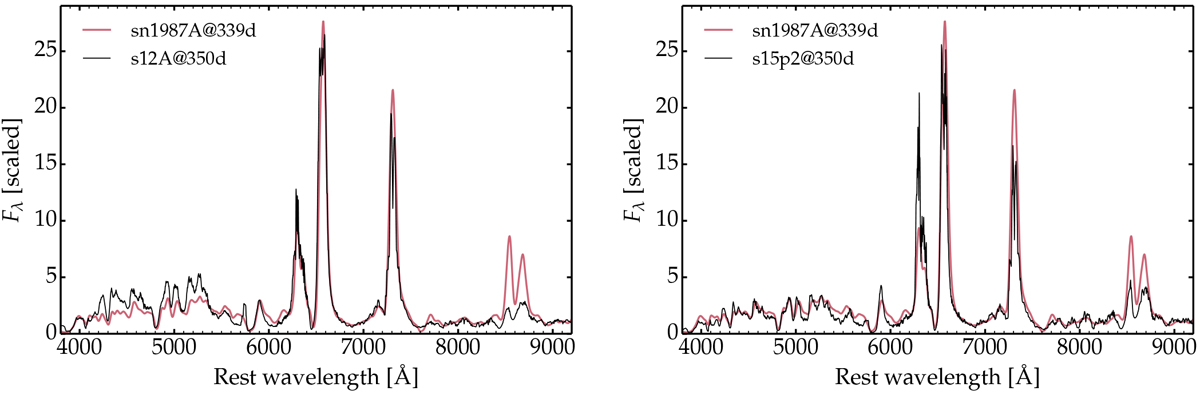
Same as Fig. 16, but now for a comparison of model s12A (M(56Ni) = 0.05M⊙) and s15p2 (M(56Ni) = 0.063M⊙) to SN 1987A (M(56Ni) = 0.069M⊙). Both models adopt a solar metallicity, not exactly consistent with the LMC metallicity for SN 1987A. The lower-mass progenitor does a good job at matching the three strongest lines, but severely underestimates the Ca II triplet, and does a poor job with at matching the Fe emission forest shortward of 6000 Å. By contrast, the higher mass model does a better job with the Fe emission, overestimates the O I doublet, and underestimates the Ca II line strengths. The flux normalization is done at 6800 Å.
Current usage metrics show cumulative count of Article Views (full-text article views including HTML views, PDF and ePub downloads, according to the available data) and Abstracts Views on Vision4Press platform.
Data correspond to usage on the plateform after 2015. The current usage metrics is available 48-96 hours after online publication and is updated daily on week days.
Initial download of the metrics may take a while.