Fig. 2.
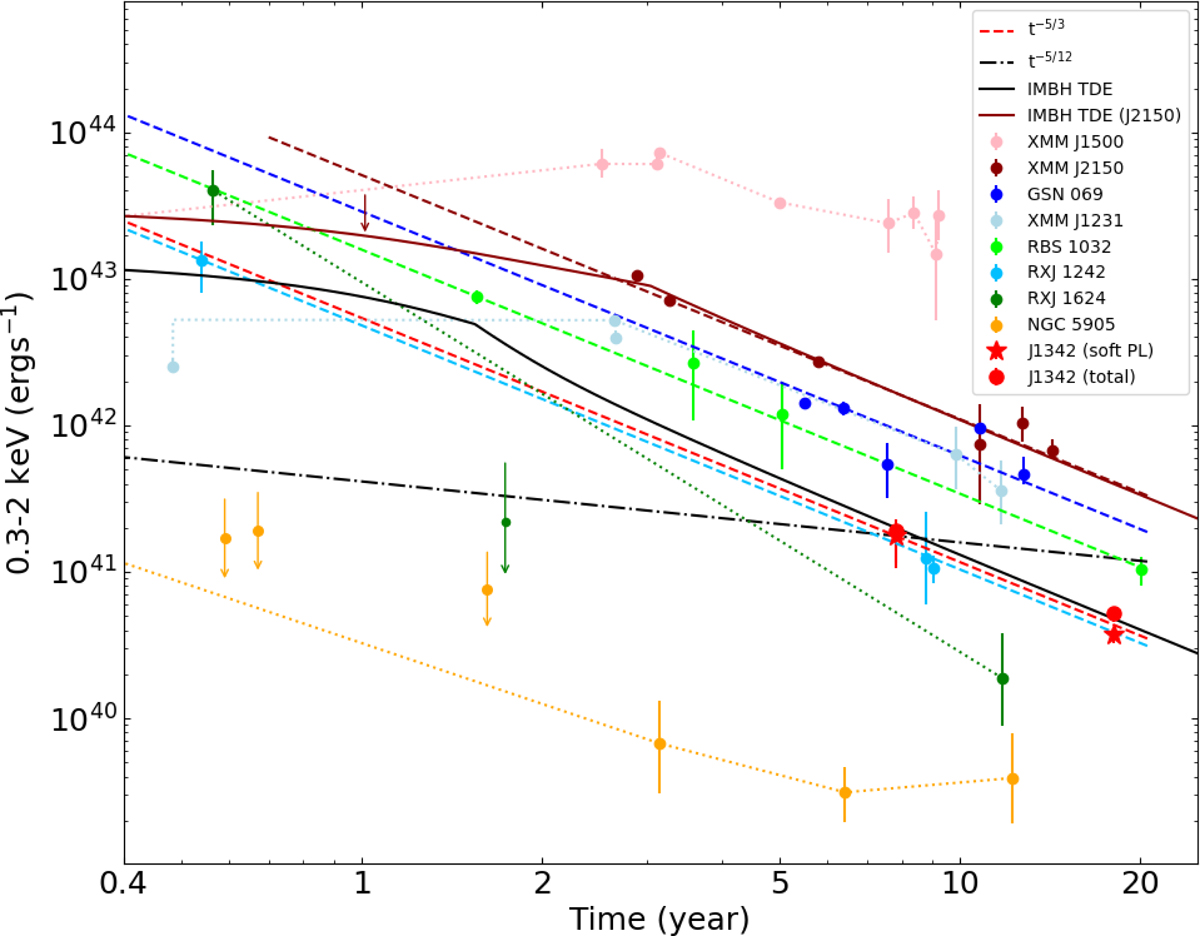
Later X-ray light curves of TDEs in 0.3-2 keV. The x-axis indicates the time since the flare occurred; for J1342, it is about 1 year before the SDSS optical spectral observation. The total 0.3–2 keV luminosities of J1342 is labeled as a circle symbol; the 0.3–2 keV luminosities of the soft PL component of J1342 is labeled as a pentagram symbol. The later X-ray light curves of other long-lived TDEs are also shown, which include RX J1242.6-1119, RX J1624.9+7554, NGC 5905 (Vaughan et al. 2004), RBS 1032 (Maksym et al. 2014), 3XMM J1500+0154 (Lin et al. 2017a), 3XMM J2150−0551 (Lin et al. 2018, 2020), 2XMM J1231+1106 (Lin et al. 2017b), and GSN 069 (Shu et al. 2018). The luminosities of XMM J1500+0154 are in 0.34–11.5 keV, of RBS 1032 are in 0.1–2.4 keV, and of XMM J2150-0551 are the bolometric luminosities from the disk model; the luminosities of others are converted to those in the 0.3–2 keV band. The later light curves following the power law decline as t−5/3 are shown as dashed lines; the others are shown as dotted lines. A power law decline as t−5/12 is also shown as a dot-dashed line. The theoretical IMBH-TDE light curve (Chen & Shen 2018) is shown as a solid line.
Current usage metrics show cumulative count of Article Views (full-text article views including HTML views, PDF and ePub downloads, according to the available data) and Abstracts Views on Vision4Press platform.
Data correspond to usage on the plateform after 2015. The current usage metrics is available 48-96 hours after online publication and is updated daily on week days.
Initial download of the metrics may take a while.