Fig. 6
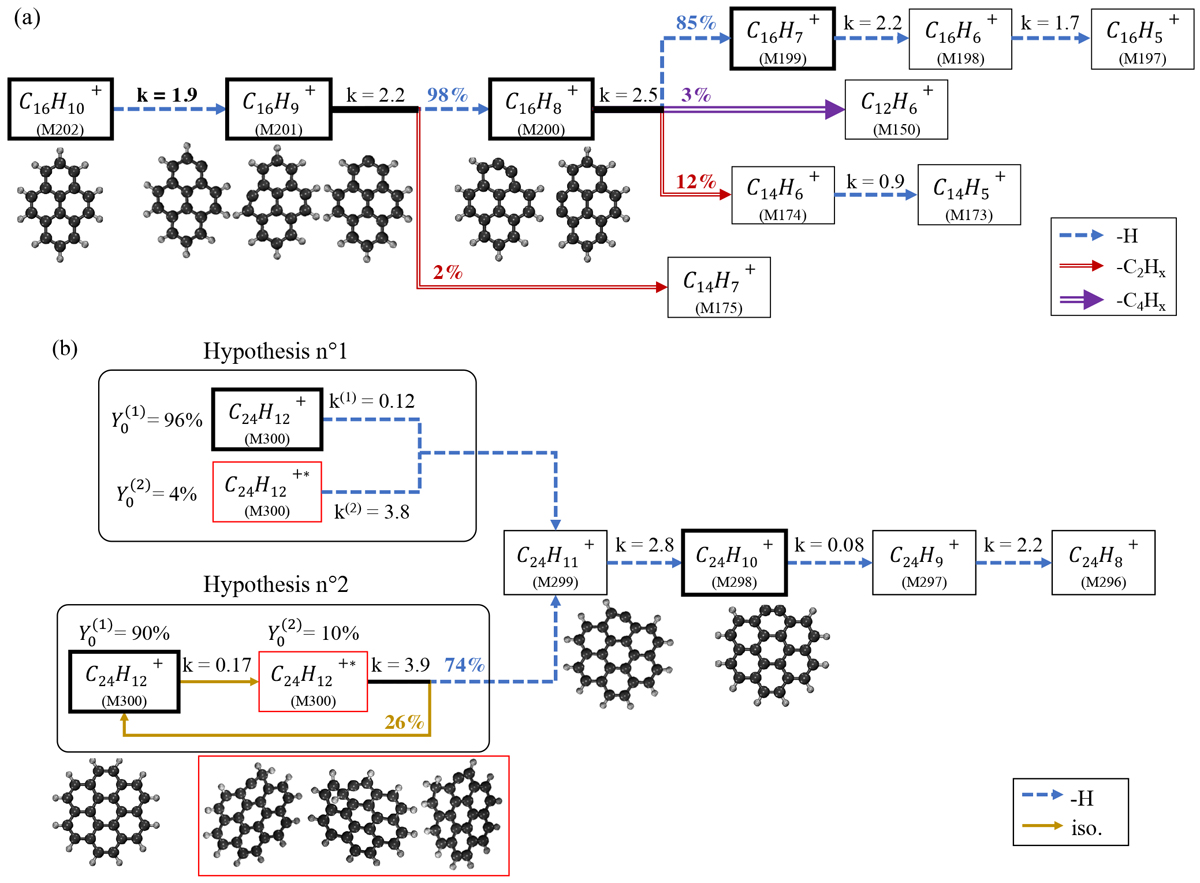
VUV photofragmentation map of (a) Pyr+ and (b) Cor+. Each arrow represents a specific fragment loss or an involved mechanism triggered by a VUV photon absorption (a legend is provided for each map). The fragmentation rates kfrag (here k for simplification) are displayed in units of 10−3 s−1. When needed, the branching ratios are also displayed. The optimized molecular structures are depicted for the parent cations and the key fragments, as well as their expected isomers. Bold boxes correspond to the major ion channels (yield higher than 10% during the kinetics). The case of Cor+ is peculiar since the fitting requires the contribution of a population of isomers (red box). Two plausible scenarios connecting the parent to the isomers are shown.
Current usage metrics show cumulative count of Article Views (full-text article views including HTML views, PDF and ePub downloads, according to the available data) and Abstracts Views on Vision4Press platform.
Data correspond to usage on the plateform after 2015. The current usage metrics is available 48-96 hours after online publication and is updated daily on week days.
Initial download of the metrics may take a while.