Fig. B.1
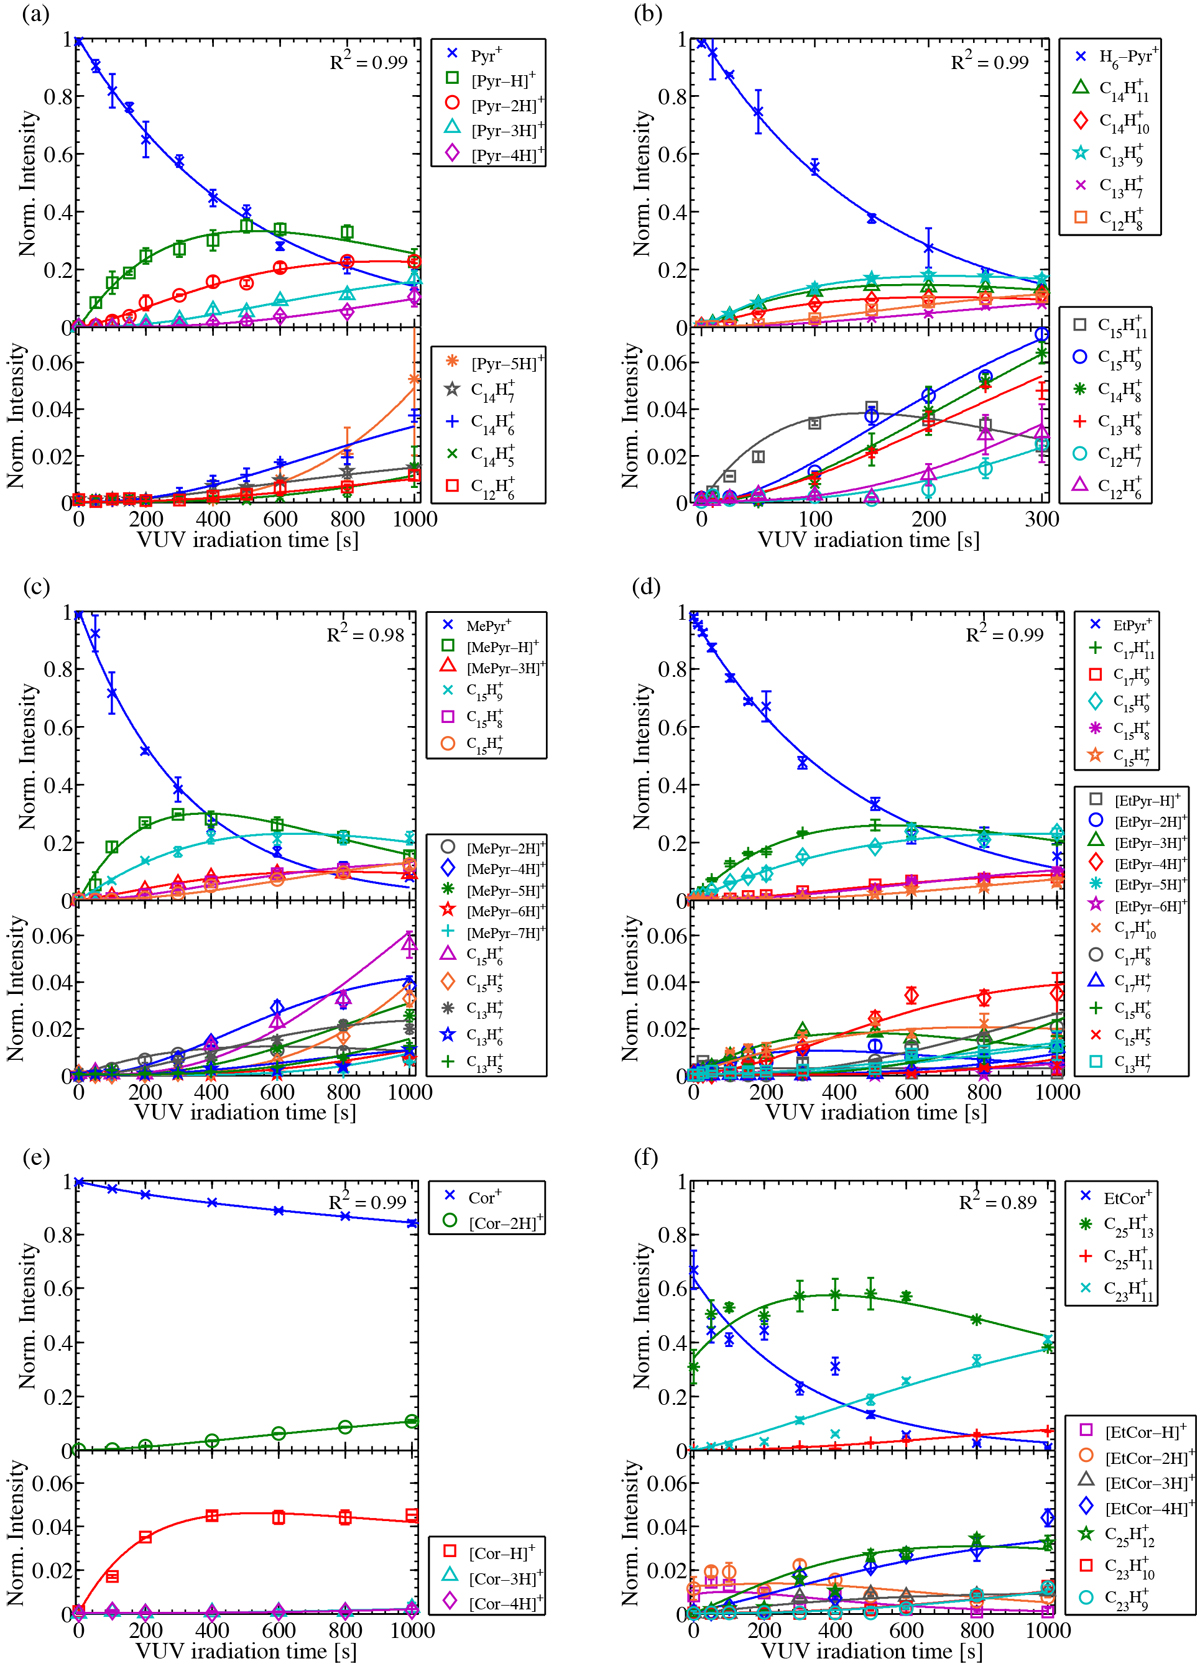
Kinetic curves of the studied PAH cations and their fragments: (a) Pyr+, (b) H6 -Pyr+, (c) MePyr+, (d) EtPyr+, (e) Cor+, (f) EtCor+ (MeCor+ is shown in Fig. 4a). For each figure, the top panel shows the main channels while the bottom panel is a zoom on the minor channels. The solid curves correspond to the fitting functions that were derived with the procedure described in Sect. 2.4. The derived photofragmentation maps are shown in Figs. 6, 8, and 9.
Current usage metrics show cumulative count of Article Views (full-text article views including HTML views, PDF and ePub downloads, according to the available data) and Abstracts Views on Vision4Press platform.
Data correspond to usage on the plateform after 2015. The current usage metrics is available 48-96 hours after online publication and is updated daily on week days.
Initial download of the metrics may take a while.