Open Access
Fig. 8
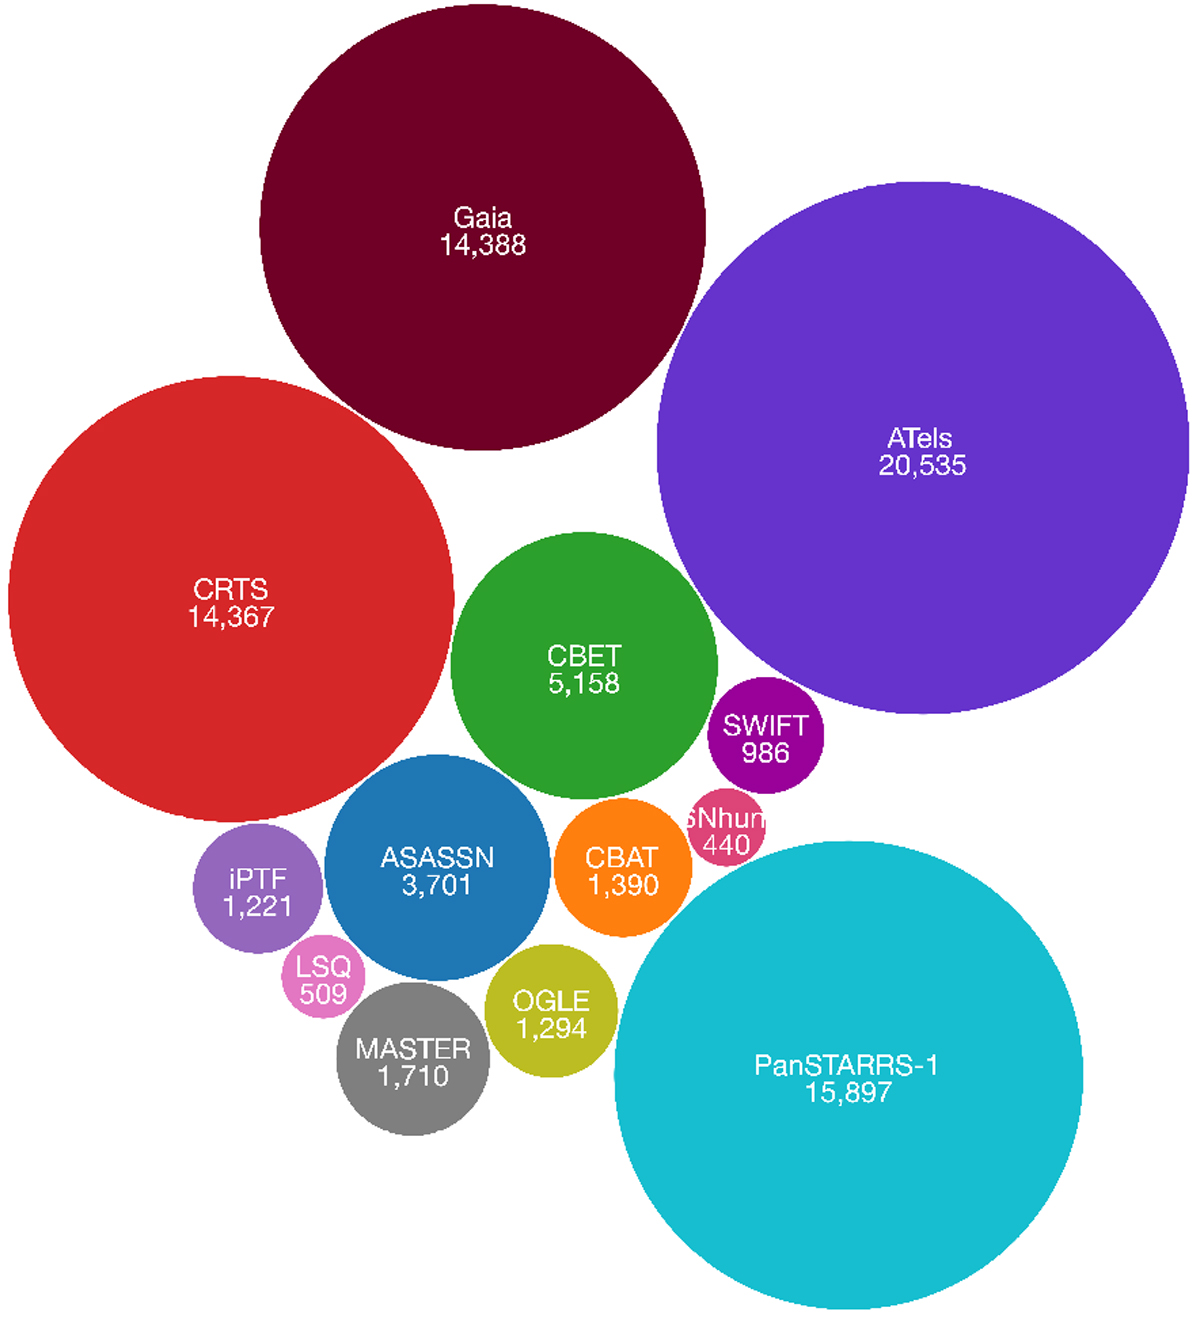
Circles proportional in area to the unique numbers of objects/events (also shown in text), compiled for the GSA database, and colour-coded by the data source. The circle for Gaia is shown for comparison. References for the surveys are given in the text. The data are taken from a snapshot of our archive on 24 November 2020.
Current usage metrics show cumulative count of Article Views (full-text article views including HTML views, PDF and ePub downloads, according to the available data) and Abstracts Views on Vision4Press platform.
Data correspond to usage on the plateform after 2015. The current usage metrics is available 48-96 hours after online publication and is updated daily on week days.
Initial download of the metrics may take a while.