Fig. 5
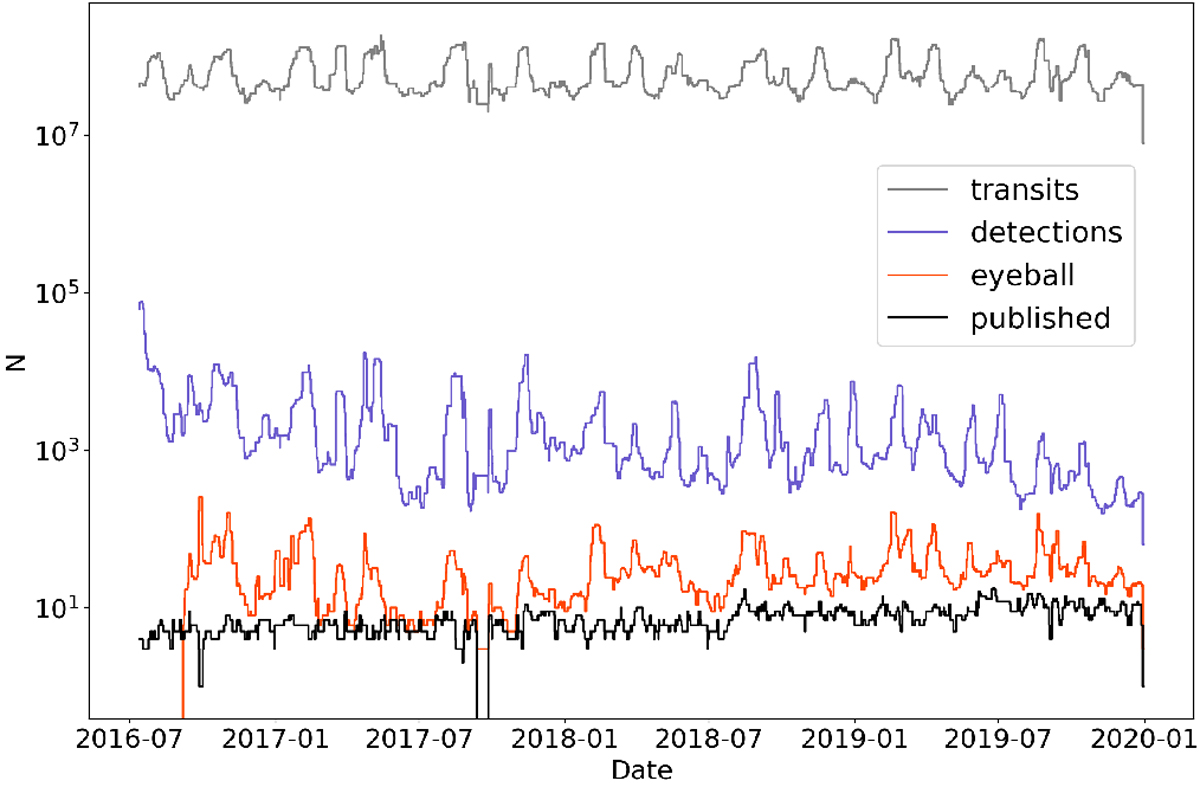
Histograms showing the time evolution of four quantities (all are totals per-IDT run): (1) numbers of transits processed by AlertPipe (in grey), (2) numbers of automated alert detections from AlertPipe (in blue), (3) numbers of alerts presented to eyeballers after additional (mostly environmental) filtering (in red), (4) numbers of alerts published from each run (in black). A 7-day running median filter has been applied to all totals. Note that no records of eyeballing statistics were preserved for the first months of 2016.
Current usage metrics show cumulative count of Article Views (full-text article views including HTML views, PDF and ePub downloads, according to the available data) and Abstracts Views on Vision4Press platform.
Data correspond to usage on the plateform after 2015. The current usage metrics is available 48-96 hours after online publication and is updated daily on week days.
Initial download of the metrics may take a while.