Fig. 4
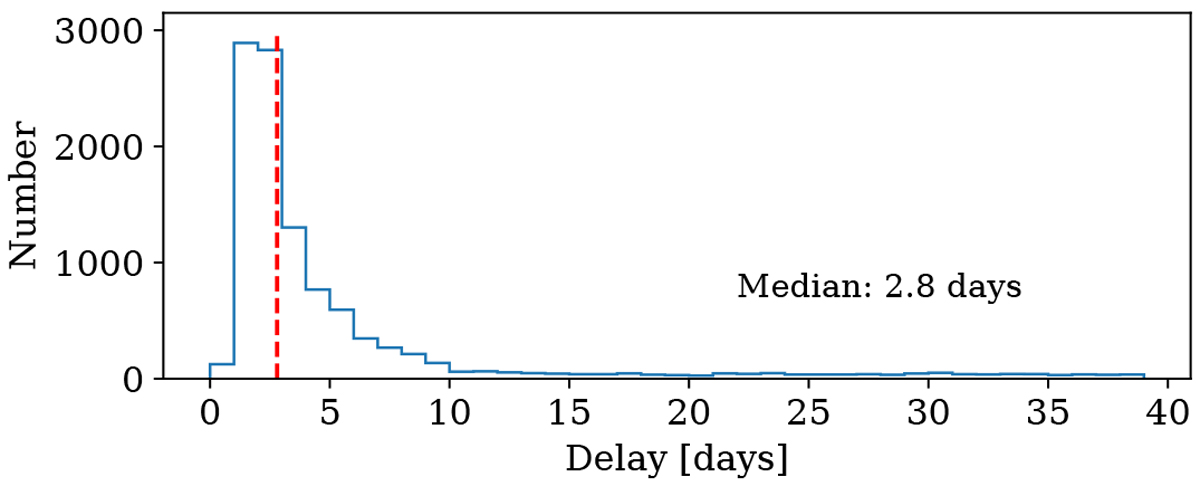
Histogram of the delay (in days) between the Gaia observation and the publication of an alert. The long tail is the result of allowing the two FOVs that we require the alert to be seen in, to be separated by up to 40 days. Twelve per cent of the alerts have a publication delay longer than 10 days. The median delay is 2.8 days and is indicated by a dashed vertical line.
Current usage metrics show cumulative count of Article Views (full-text article views including HTML views, PDF and ePub downloads, according to the available data) and Abstracts Views on Vision4Press platform.
Data correspond to usage on the plateform after 2015. The current usage metrics is available 48-96 hours after online publication and is updated daily on week days.
Initial download of the metrics may take a while.