Open Access
Fig. 22
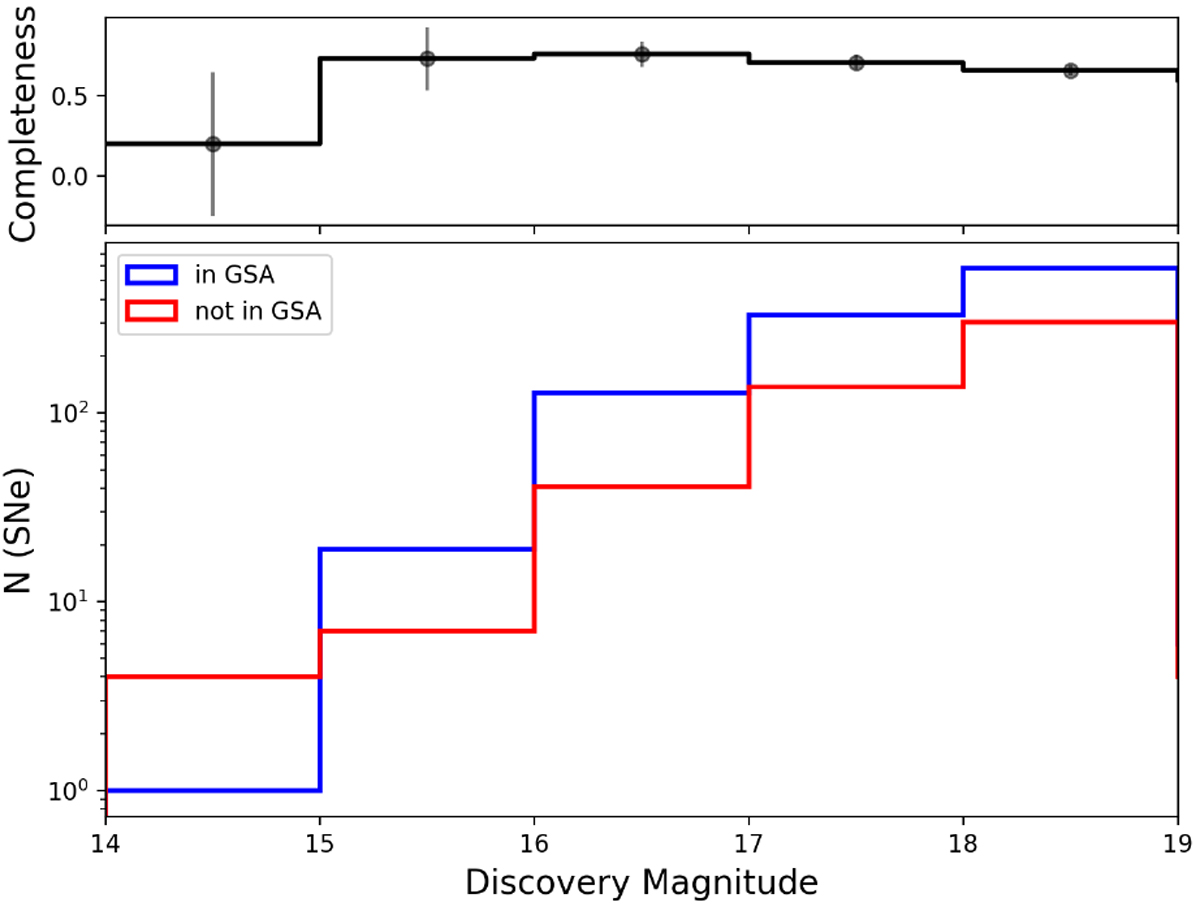
Completeness as a function of magnitude for SNe with 2 or more Gaia scans. Main panel: histograms are divided into two samples: blue independently detected and published by GSA, red not detected and published by GSA. Upper panel: fraction of the total number detected by GSA.
Current usage metrics show cumulative count of Article Views (full-text article views including HTML views, PDF and ePub downloads, according to the available data) and Abstracts Views on Vision4Press platform.
Data correspond to usage on the plateform after 2015. The current usage metrics is available 48-96 hours after online publication and is updated daily on week days.
Initial download of the metrics may take a while.