Fig. 20
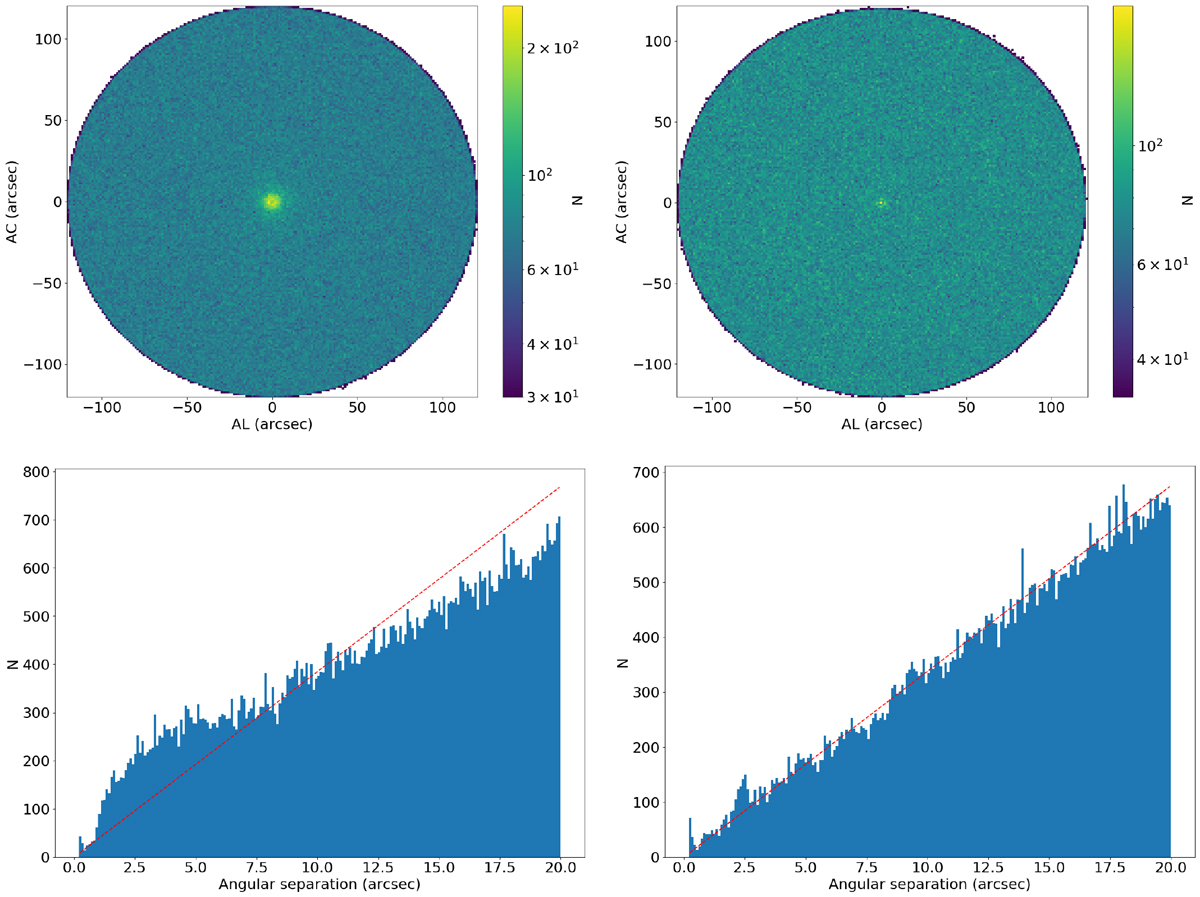
Top: number of neighbouring sources within 2′ of each published alert in the AL and AC directions at the time of the alert, accumulated for all NewSource alerts (left), and for all OldSource alerts (right). Again all sources within 0.2′′ of the alert positions are excluded as they are deemed to belong to the alerts themselves. Bottom: number of neighbouring sources as a function of angular separation out to 20′′ around the published alert, accumulated for all NewSource alerts (left), and for all OldSource alerts (right). The red dashed line is the expectation for the number of sources based on the assumption of the same number of sources per unit area. Here we can see that the excess in the number of sources at very close angular separations, is much more pronounced for NewSource alerts than for OldSource alerts. The range of angular separations in which there is an excess in the number of neighbouring source is more clearly seen in the bottom panels. A small excess is still visible around 2.5′′ for OldSource alerts.
Current usage metrics show cumulative count of Article Views (full-text article views including HTML views, PDF and ePub downloads, according to the available data) and Abstracts Views on Vision4Press platform.
Data correspond to usage on the plateform after 2015. The current usage metrics is available 48-96 hours after online publication and is updated daily on week days.
Initial download of the metrics may take a while.