Fig. 2
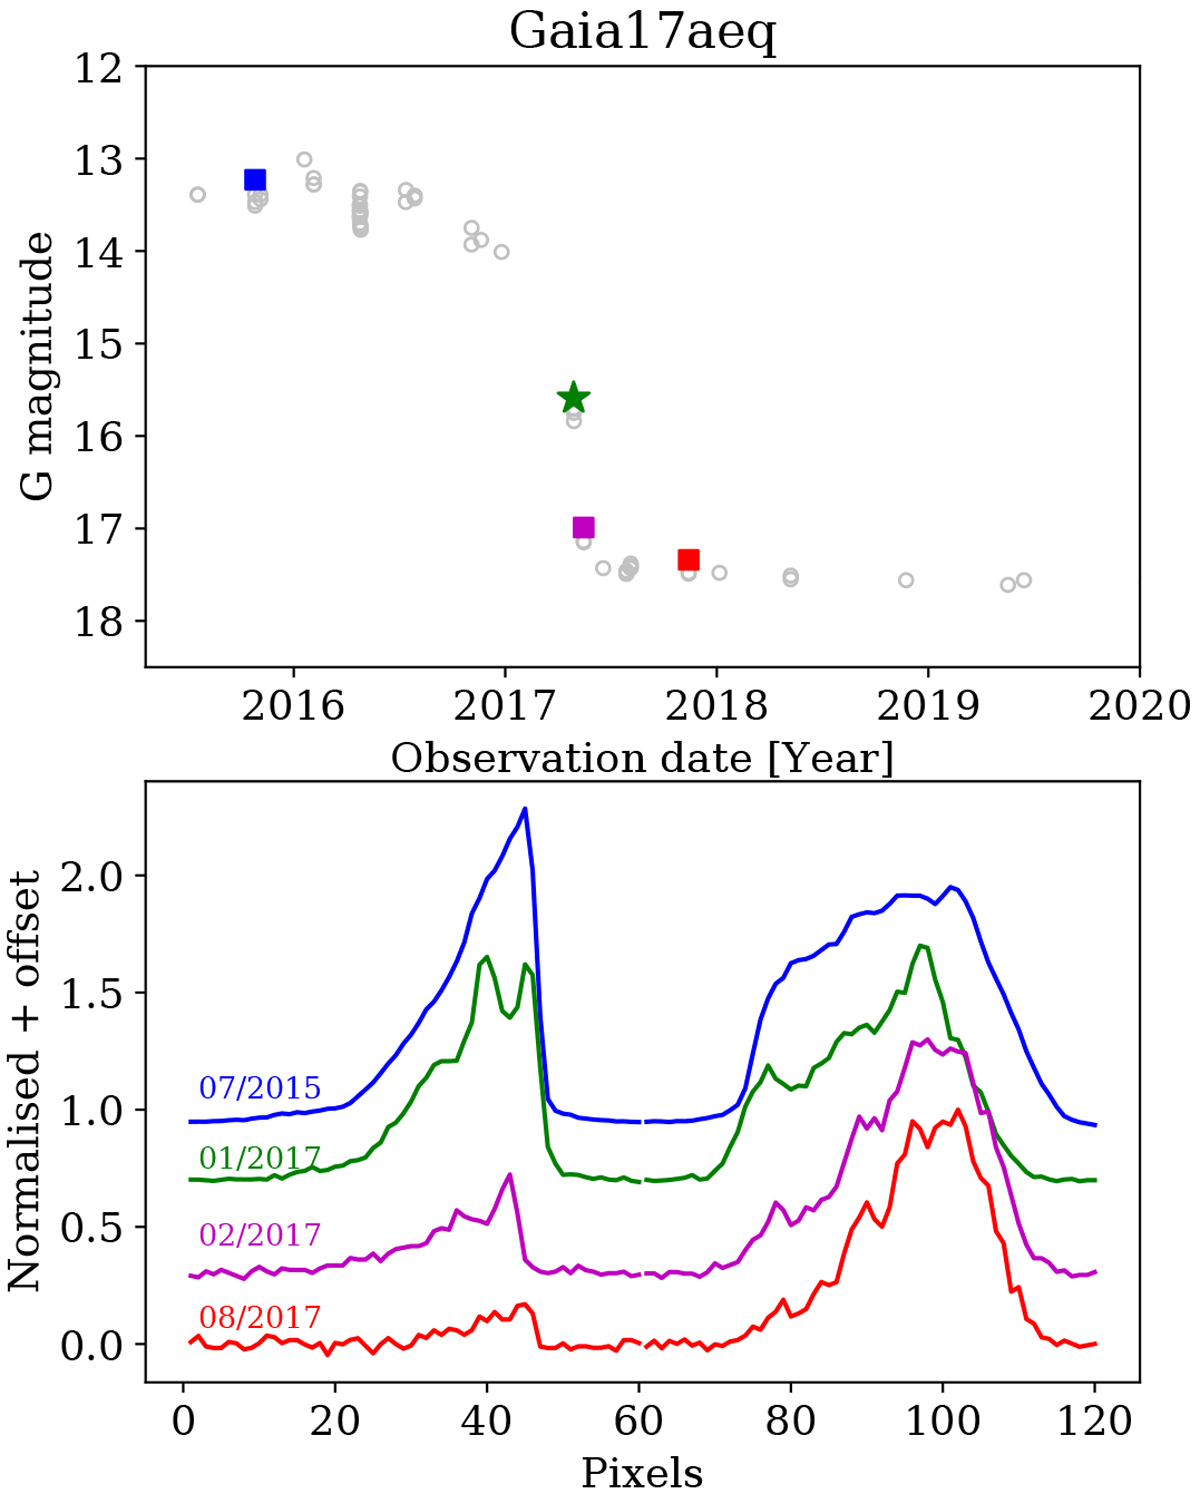
Lightcurve (upper panel) and spectral variation (lower panel) of ASASSN-13db/Gaia17aeq. The points in the lightcurve for which the BP (lower left) and RP (lower right) spectra are shown are indicated with filled symbols in the same colour. The Gaia alert was issued when the target faded, at the point indicated by the star symbol.
Current usage metrics show cumulative count of Article Views (full-text article views including HTML views, PDF and ePub downloads, according to the available data) and Abstracts Views on Vision4Press platform.
Data correspond to usage on the plateform after 2015. The current usage metrics is available 48-96 hours after online publication and is updated daily on week days.
Initial download of the metrics may take a while.