Fig. 19
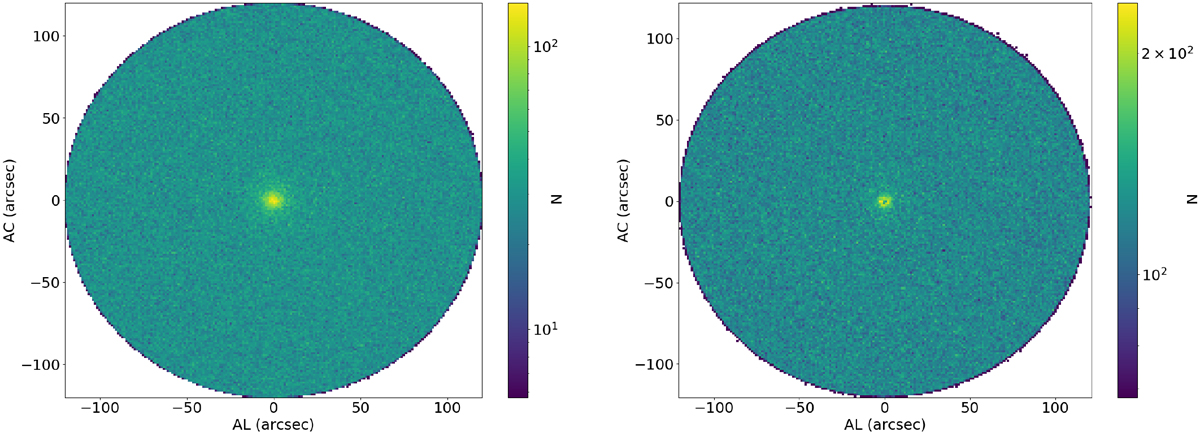
Number of neighbouring sources within 2′ of each published alert in the AL and AC directions at the time of the alert, accumulated for all alerts which are confirmed by ancillary data (left), and for the remaining alerts (right). Note that all sources within 0.2′′ of the alert positions are excluded as they are deemed to belong to the alerts themselves. The distribution of sources around the alerts shows no excess in the AL and AC directions, as might be expected were there some residual contamination due to the PSF spikes of bright stars causing false detections. There is an excess in the number of sources at very close angular separations, but this is more pronounced for the confirmed alerts than those which are not confirmed by ancillary data.
Current usage metrics show cumulative count of Article Views (full-text article views including HTML views, PDF and ePub downloads, according to the available data) and Abstracts Views on Vision4Press platform.
Data correspond to usage on the plateform after 2015. The current usage metrics is available 48-96 hours after online publication and is updated daily on week days.
Initial download of the metrics may take a while.