Open Access
Fig. 11
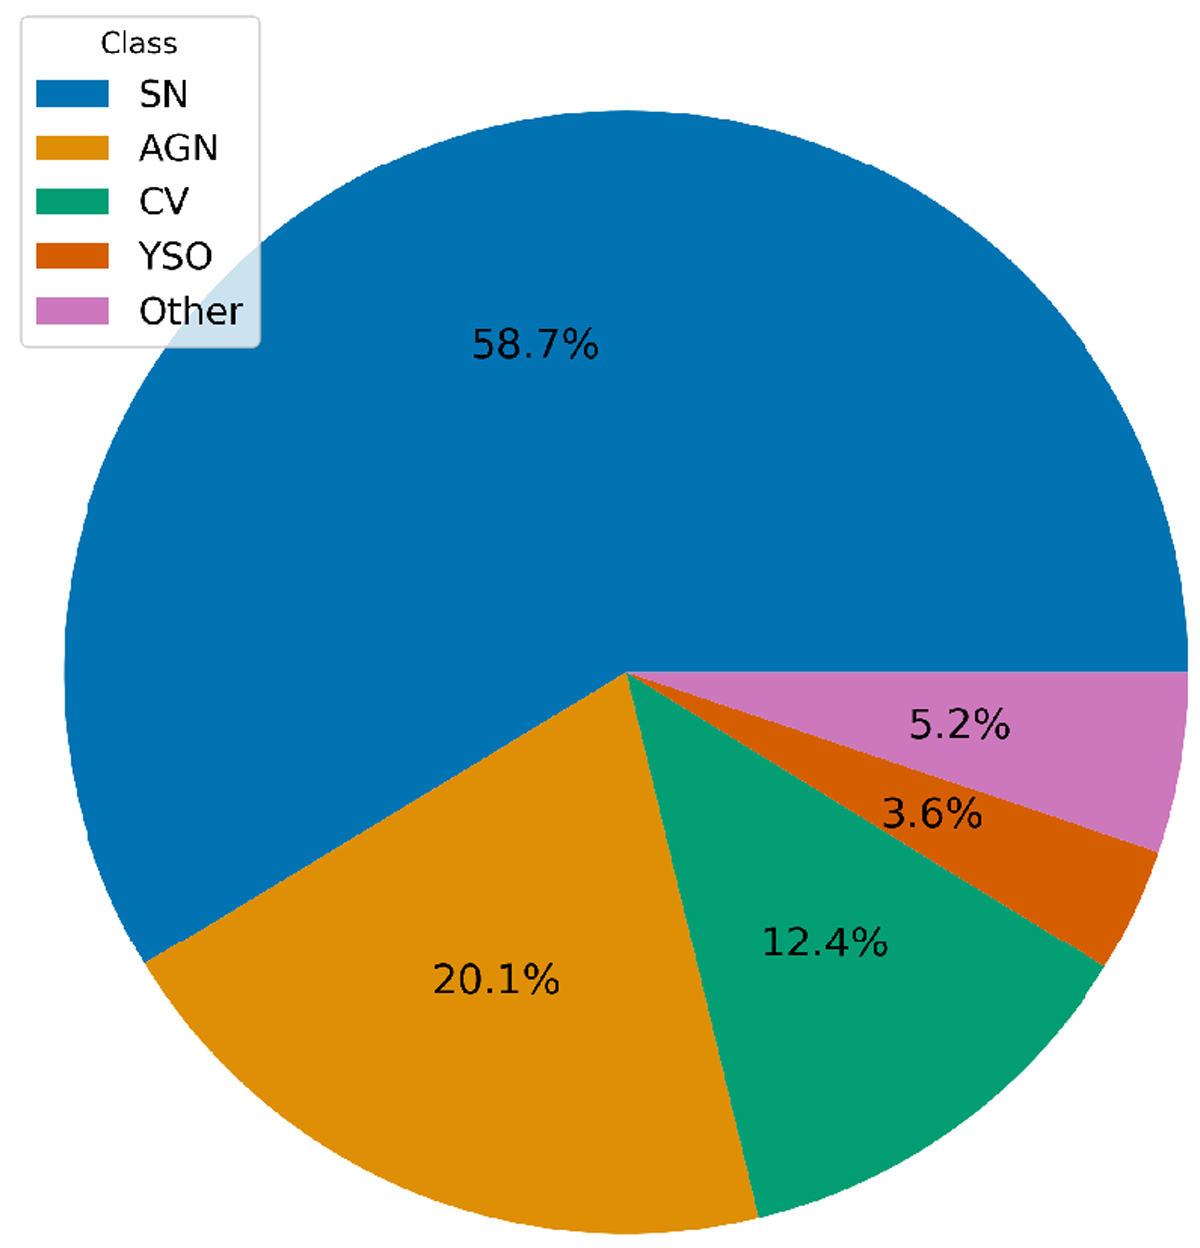
Distribution of the most common classifications for alerts from GSA. As discussed in the text, there is strong bias in the rate of follow-up and classification in favour of events which look like supernovae or other extragalactic transients.
Current usage metrics show cumulative count of Article Views (full-text article views including HTML views, PDF and ePub downloads, according to the available data) and Abstracts Views on Vision4Press platform.
Data correspond to usage on the plateform after 2015. The current usage metrics is available 48-96 hours after online publication and is updated daily on week days.
Initial download of the metrics may take a while.