Fig. 10
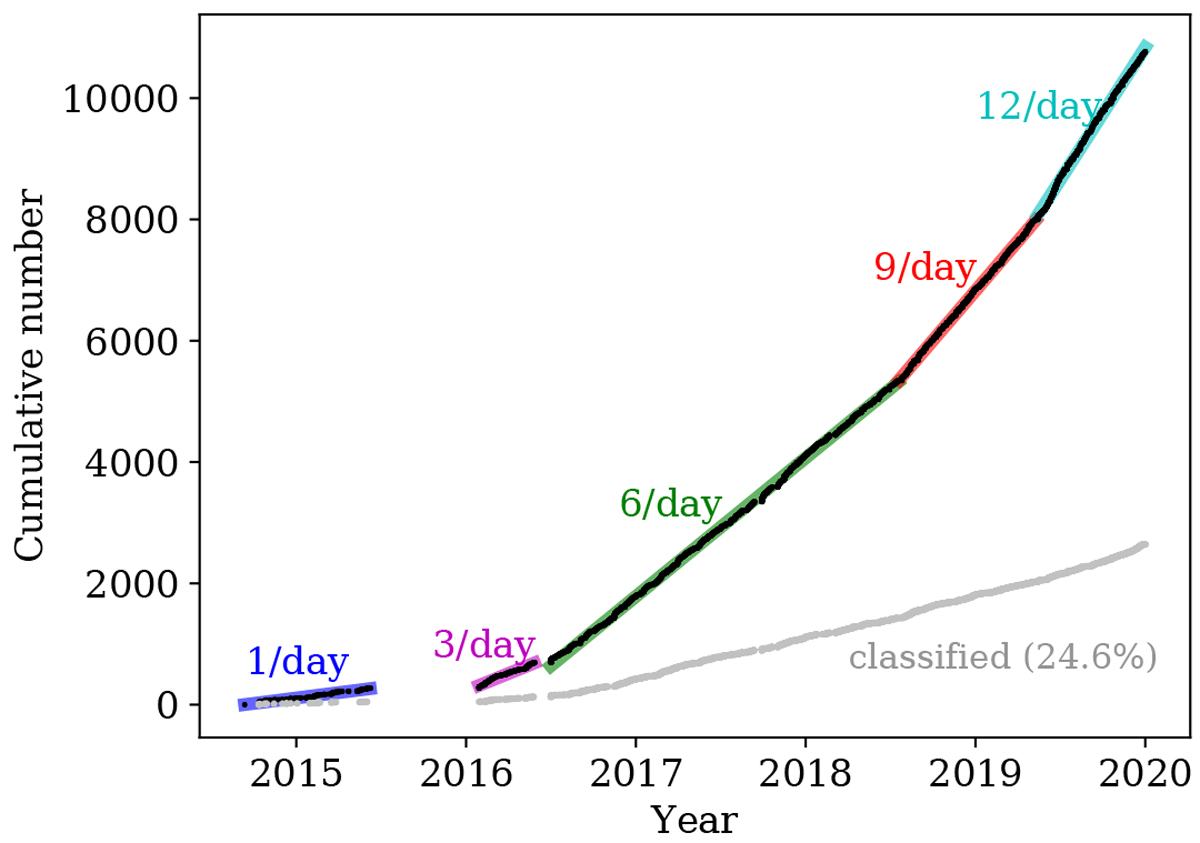
Cumulative number of alerts detected as a function of publication date. Changes in the alert rate correspond to changes and improvements to AlertPipe, as described in this paper, which allowed us to identify alerts more reliably. Grey line shows the cumulative number of classified alerts, reaching almost 25% of all alerts by the end of 2019 (see Sect. 3.2). Figure includes alerts published from the start of operations until the end of December 2019.
Current usage metrics show cumulative count of Article Views (full-text article views including HTML views, PDF and ePub downloads, according to the available data) and Abstracts Views on Vision4Press platform.
Data correspond to usage on the plateform after 2015. The current usage metrics is available 48-96 hours after online publication and is updated daily on week days.
Initial download of the metrics may take a while.