Fig. 3
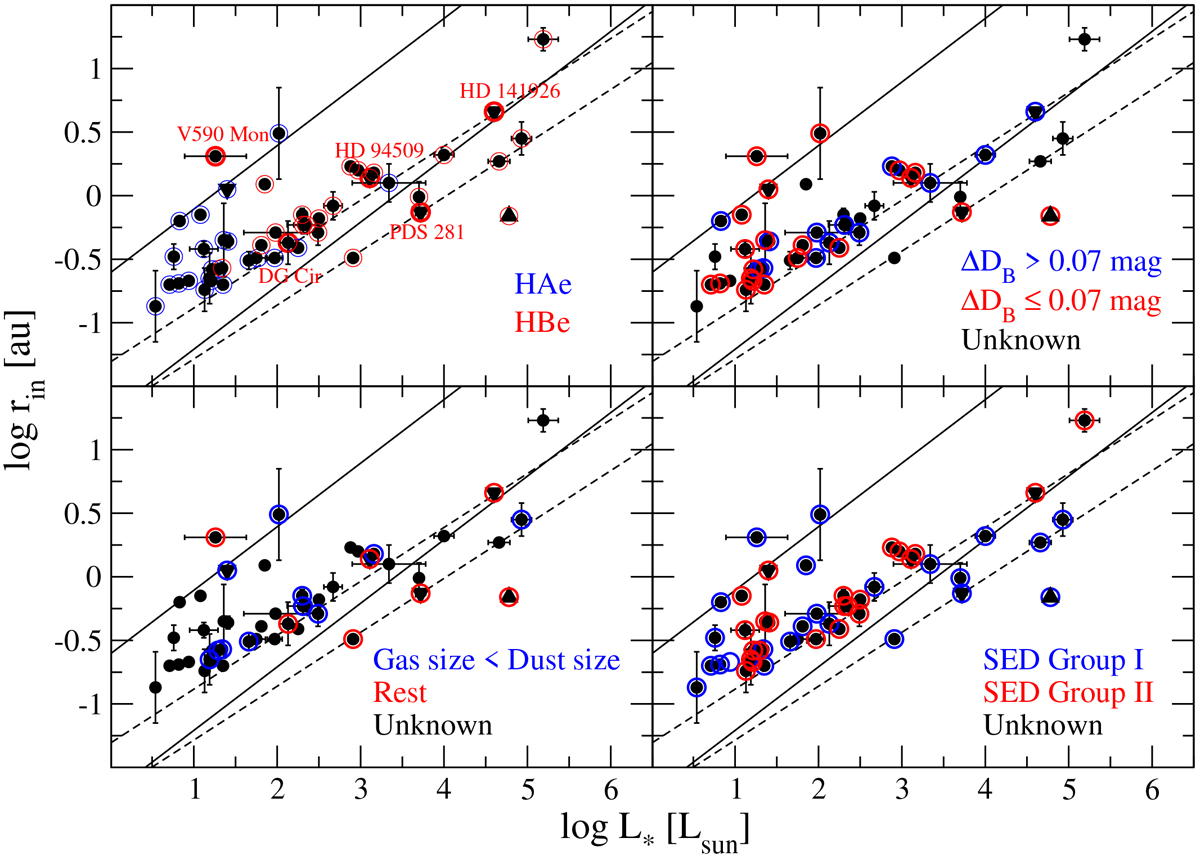
Size-luminosity relation based on data compiled in Tables 3 and 4 for HAeBes. Each panel emphasizes a different aspect, as indicated in the legends. Top left: HAes and HBes; the five with new GRAVITY data presented in this paper are highlighted in red. Top right: the HAeBes with Balmer excess measurements above and below the median value (0.07 magnitudes). Bottom left: the HAeBes with spectro-interferometric measurements indicating that the Brγ/Hα emitting region is smaller than the dust emitting region and the ones without such evidence. Bottom right: Group I and Group II sources based on the SED shape. (All panels): triangles indicate upper and lower limits, and the solid and dashed lines indicate the expected boundaries of rin for an optically thin-MA and optically thick-BL inner gaseous disks, respectively (see text for details).
Current usage metrics show cumulative count of Article Views (full-text article views including HTML views, PDF and ePub downloads, according to the available data) and Abstracts Views on Vision4Press platform.
Data correspond to usage on the plateform after 2015. The current usage metrics is available 48-96 hours after online publication and is updated daily on week days.
Initial download of the metrics may take a while.