Fig. 7.
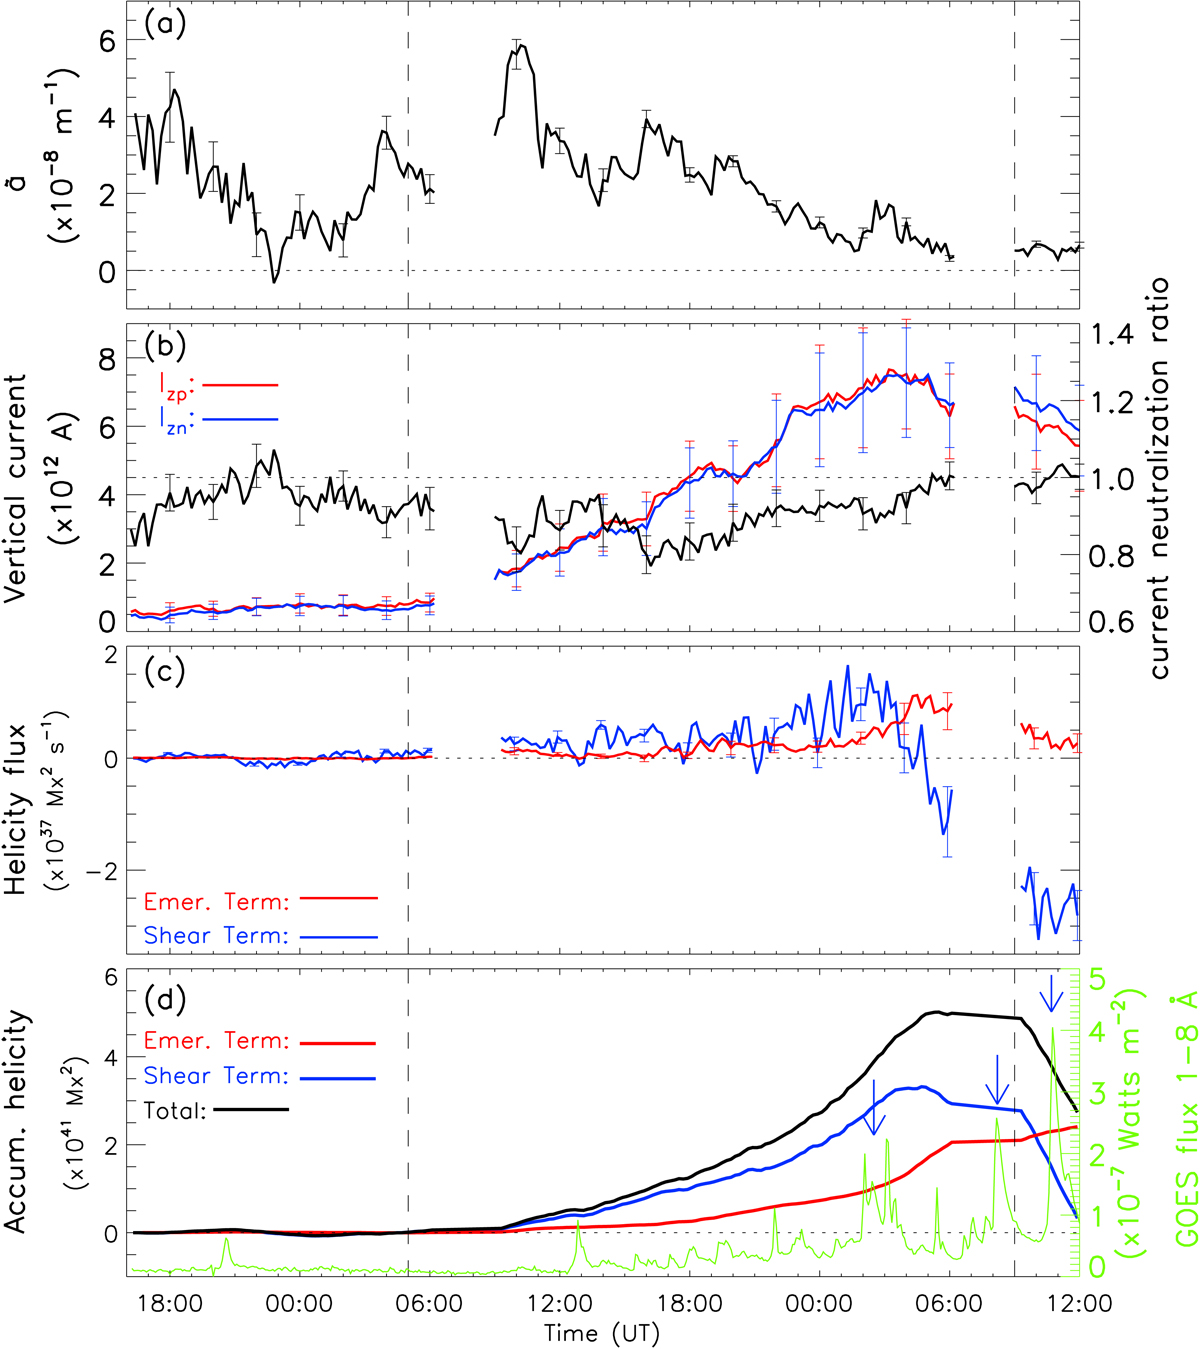
Evolution of different magnetic parameters in the active region during the period from 16:12 UT on August 23 to 12:00 UT on August 25, 2018: panel a: flux-weighted force-free parameter (α̃); panel b: vertical electric currents and the current neutralization ratio. Red and blue lines denote the positive and negative vertical current, respectively. The black line plots the profile of current neutralization ratio; panel c: magnetic helicity injection flux. Red and blue lines denote the emergence term and shear term, respectively; panel d: accumulative helicity. Red and blue lines indicate the accumulative helicity contributed from emergence term and shear term. The total accumulative helicity is shown by the black line. The green line denotes the flux of GOES soft X-ray 1–8 Å. The two vertical dashed lines denote the times of 05:00 UT on August 24 and 09:00 UT on August 25. Some B-class flares are marked by blue arrows. Error bars estimated by the Monte-Carlo experiment are plotted at representative times.
Current usage metrics show cumulative count of Article Views (full-text article views including HTML views, PDF and ePub downloads, according to the available data) and Abstracts Views on Vision4Press platform.
Data correspond to usage on the plateform after 2015. The current usage metrics is available 48-96 hours after online publication and is updated daily on week days.
Initial download of the metrics may take a while.