Fig. 6.
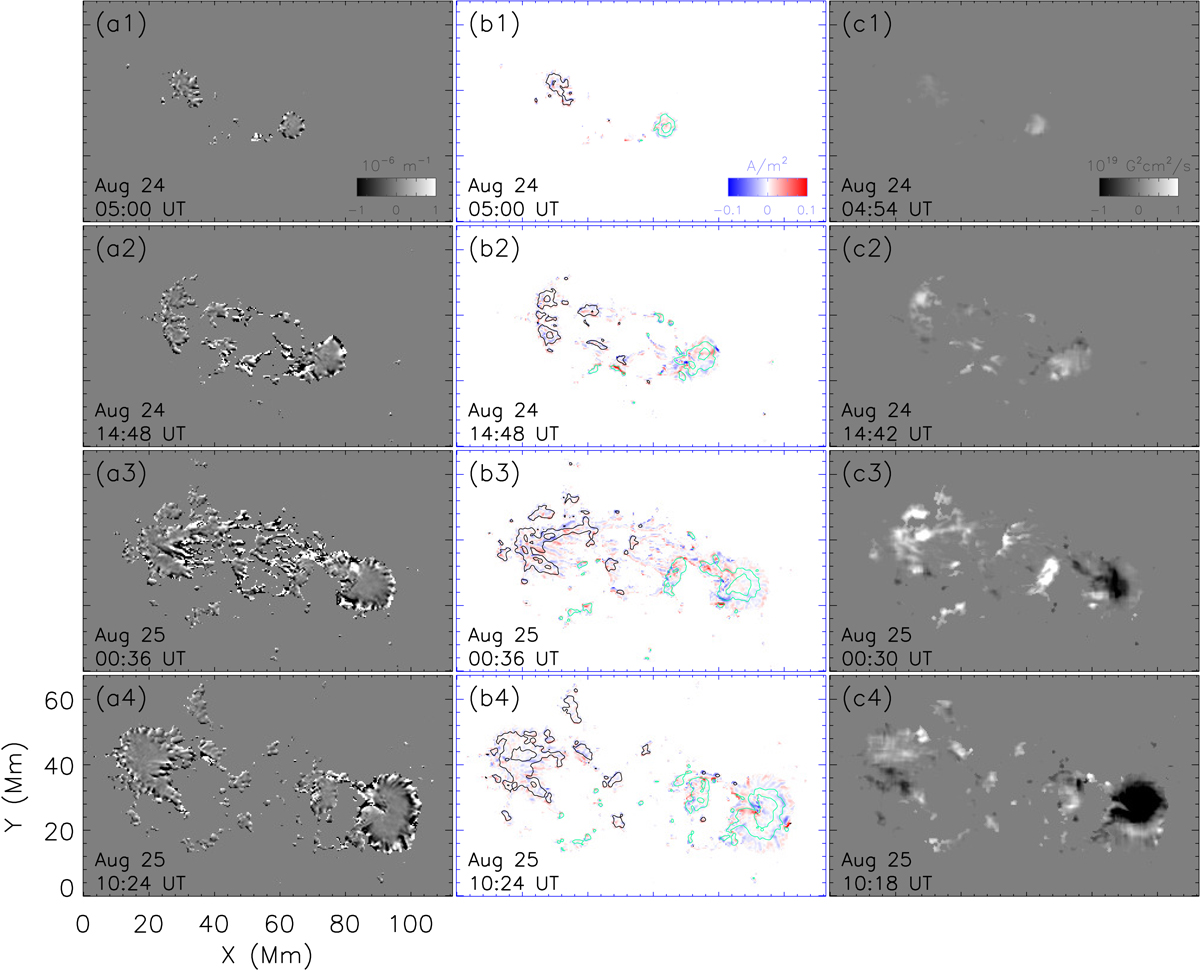
Distributions of force-free parameter (αz), vertical electric current density, proxy of heilicty flux density (Gθ); panels a1–a4: force-free parameter (αz); panels b1–b4: vertical electric current density (Jz). The pink and black contours denote the positive and negative magnetic field with the levels of 500 G, 1500 G, respectively; panels c1–c4: proxy of helicity flux density (Gθ). It only plots the pixels with the total magnetic field strength bigger than 300 G.
Current usage metrics show cumulative count of Article Views (full-text article views including HTML views, PDF and ePub downloads, according to the available data) and Abstracts Views on Vision4Press platform.
Data correspond to usage on the plateform after 2015. The current usage metrics is available 48-96 hours after online publication and is updated daily on week days.
Initial download of the metrics may take a while.