Fig. 5.
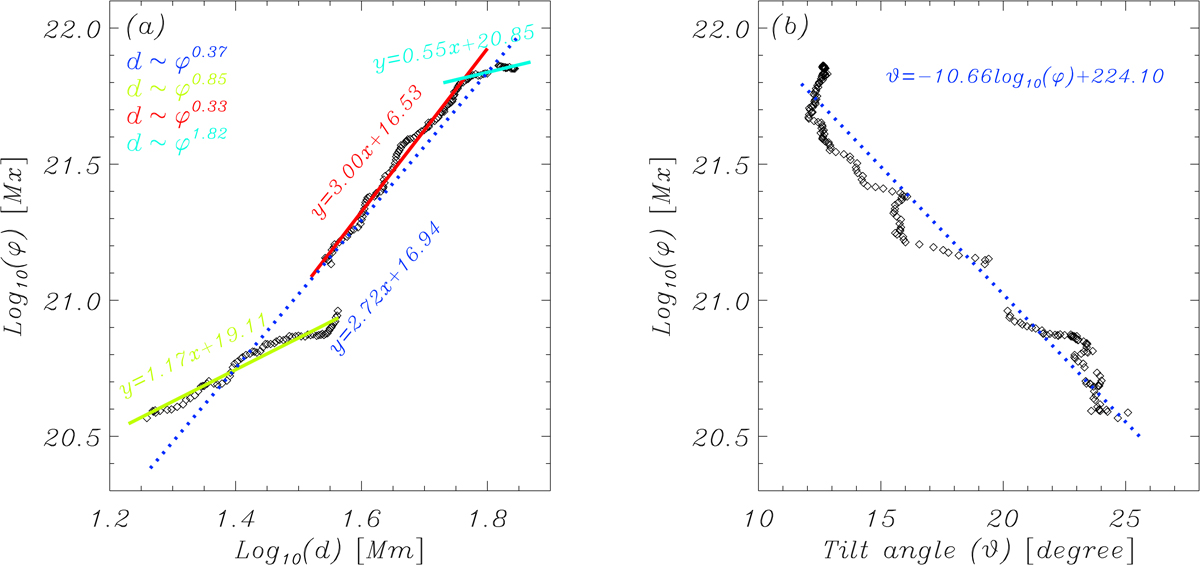
Correlation between the magnetic flux and pole separation or tilt angle; panel a: profile of total magnetic flux as a function of the pole separation. The different color lines denote the fitting lines with different slopes. The different color functions depict the results of different fitting lines by using the linear fit; panel b: profile of total magnetic flux as a function of the tilt angle. The fitting line by linear function is indicated by the blue dotted line.
Current usage metrics show cumulative count of Article Views (full-text article views including HTML views, PDF and ePub downloads, according to the available data) and Abstracts Views on Vision4Press platform.
Data correspond to usage on the plateform after 2015. The current usage metrics is available 48-96 hours after online publication and is updated daily on week days.
Initial download of the metrics may take a while.