Fig. 4.
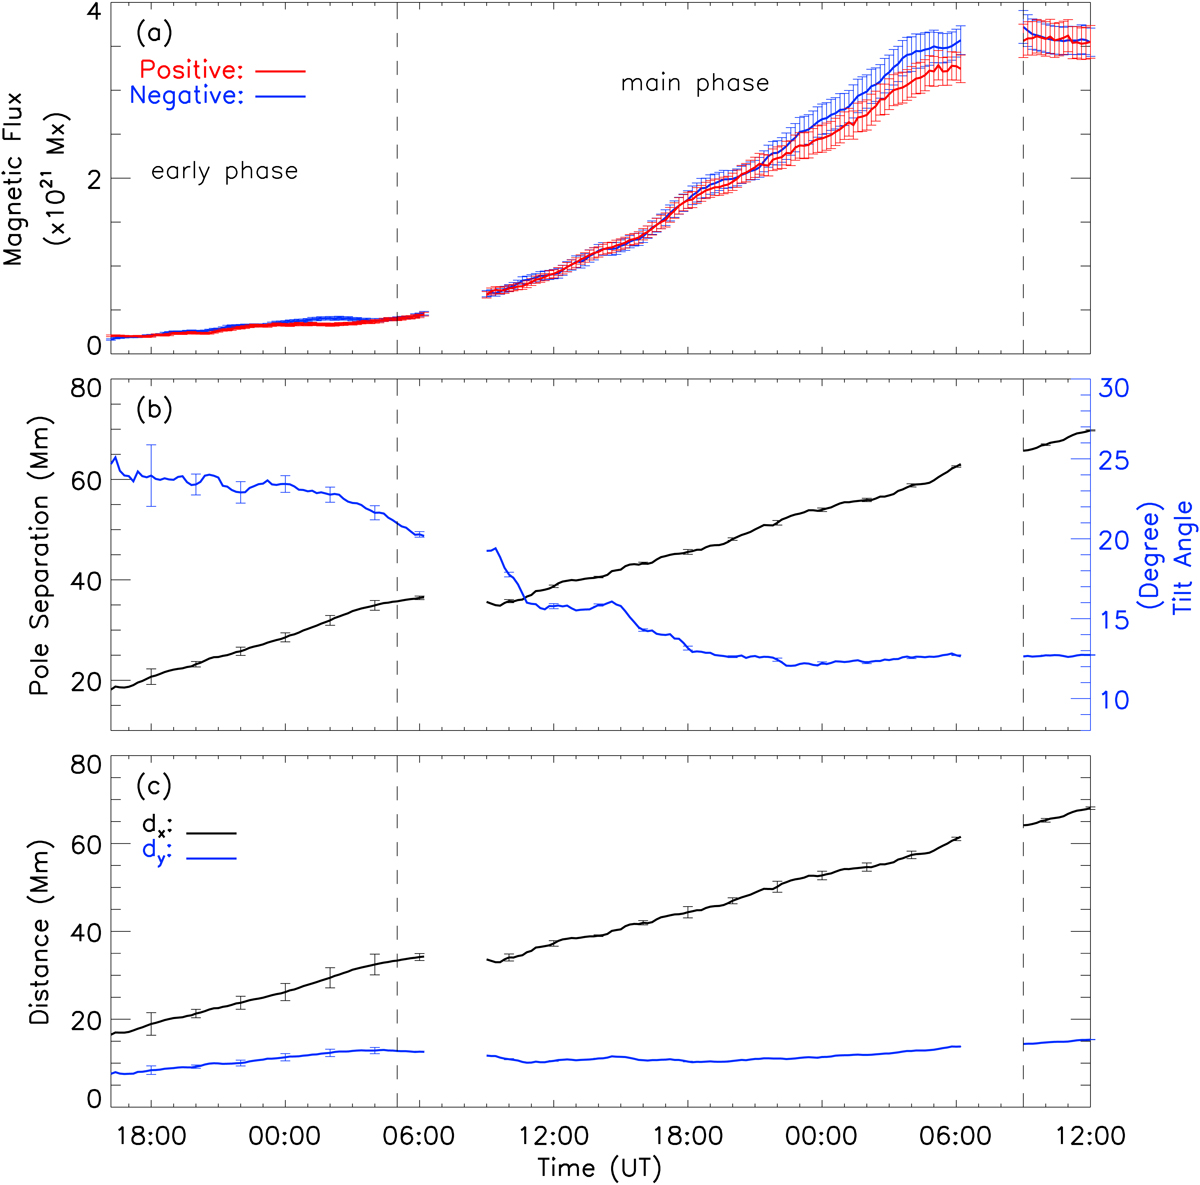
Variations of magnetic flux, pole separation, and tilt angle of the emerging active region during the period from 16:12 UT on August 23 to 12:00 UT on August 25, 2018. Panel a: evolution of positive and negative magnetic flux. The red and blue lines indicate the positive and negative magnetic flux. The errors in the positive and negative magnetic flux are estimated by the uncertainties from HMI observations of SHARP data; Panel b: evolutions of pole separation and tilt angle. The black line denotes pole separation and the blue one denotes tilt angle; Panel c: evolution of pole separation in longitude direction (dx) and latitude direction (dy). The black and blue lines denote the pole separation in longitude direction and latitude direction, respectively. Error bars, reported at several representative times in panels b and c, are estimated by using the Monte-Carlo method.
Current usage metrics show cumulative count of Article Views (full-text article views including HTML views, PDF and ePub downloads, according to the available data) and Abstracts Views on Vision4Press platform.
Data correspond to usage on the plateform after 2015. The current usage metrics is available 48-96 hours after online publication and is updated daily on week days.
Initial download of the metrics may take a while.