Fig. 2.
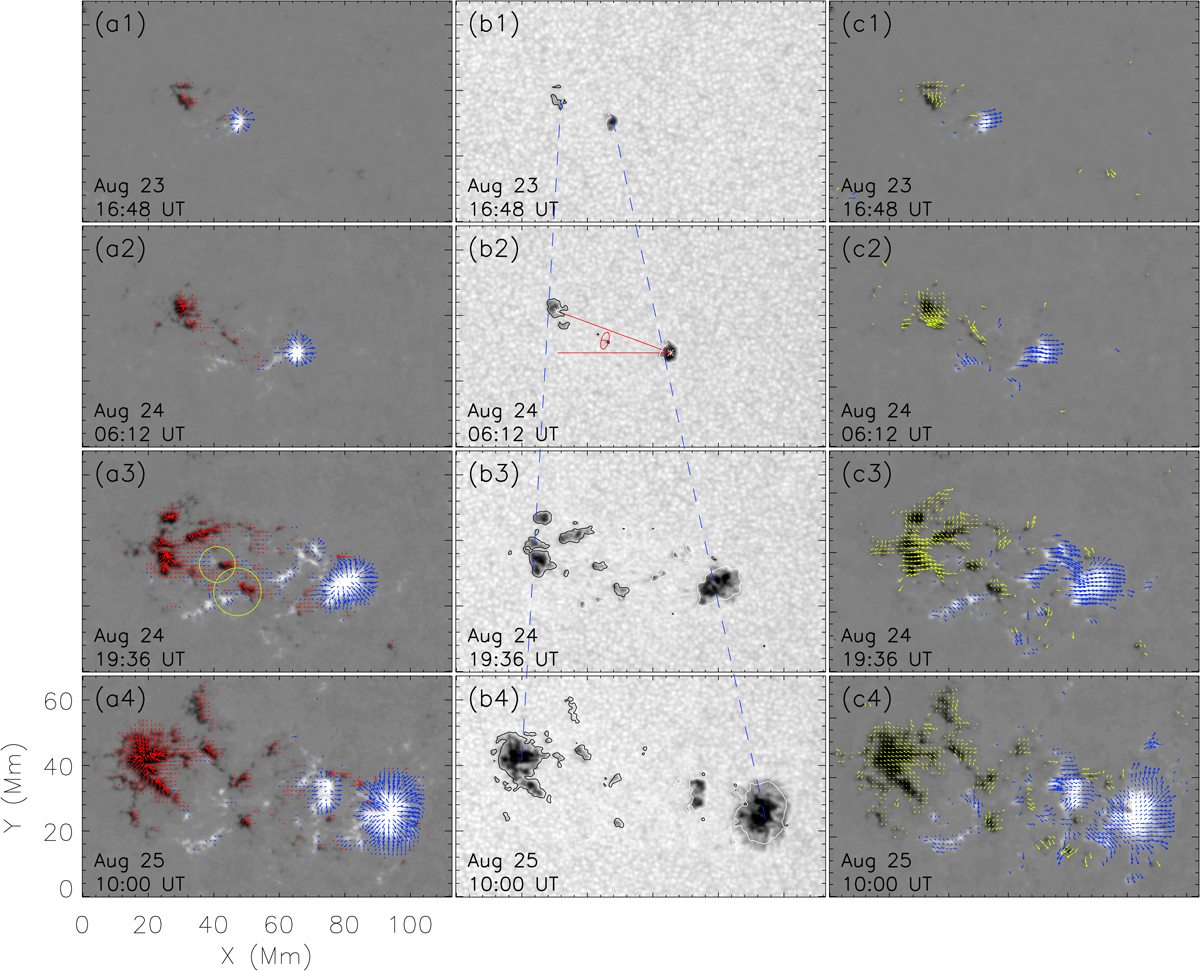
Evolution of the emerging active region NOAA 12740. Panels a1–a4: vector magnetograms. Panels b1–b4: continuum intensity images. The white and black contours indicate the magnetic field strength (800G) with positive and negative polarities, respectively. The white asterisks in panel b2 denote the centroids of positive and negative polarities; panels c1–c2: transverse velocity maps derived with DAVE4VM. The blue and green arrows indicate the transverse velocity with positive and negative polarities, respectively. An animation is available online.
Current usage metrics show cumulative count of Article Views (full-text article views including HTML views, PDF and ePub downloads, according to the available data) and Abstracts Views on Vision4Press platform.
Data correspond to usage on the plateform after 2015. The current usage metrics is available 48-96 hours after online publication and is updated daily on week days.
Initial download of the metrics may take a while.