Fig. 7.
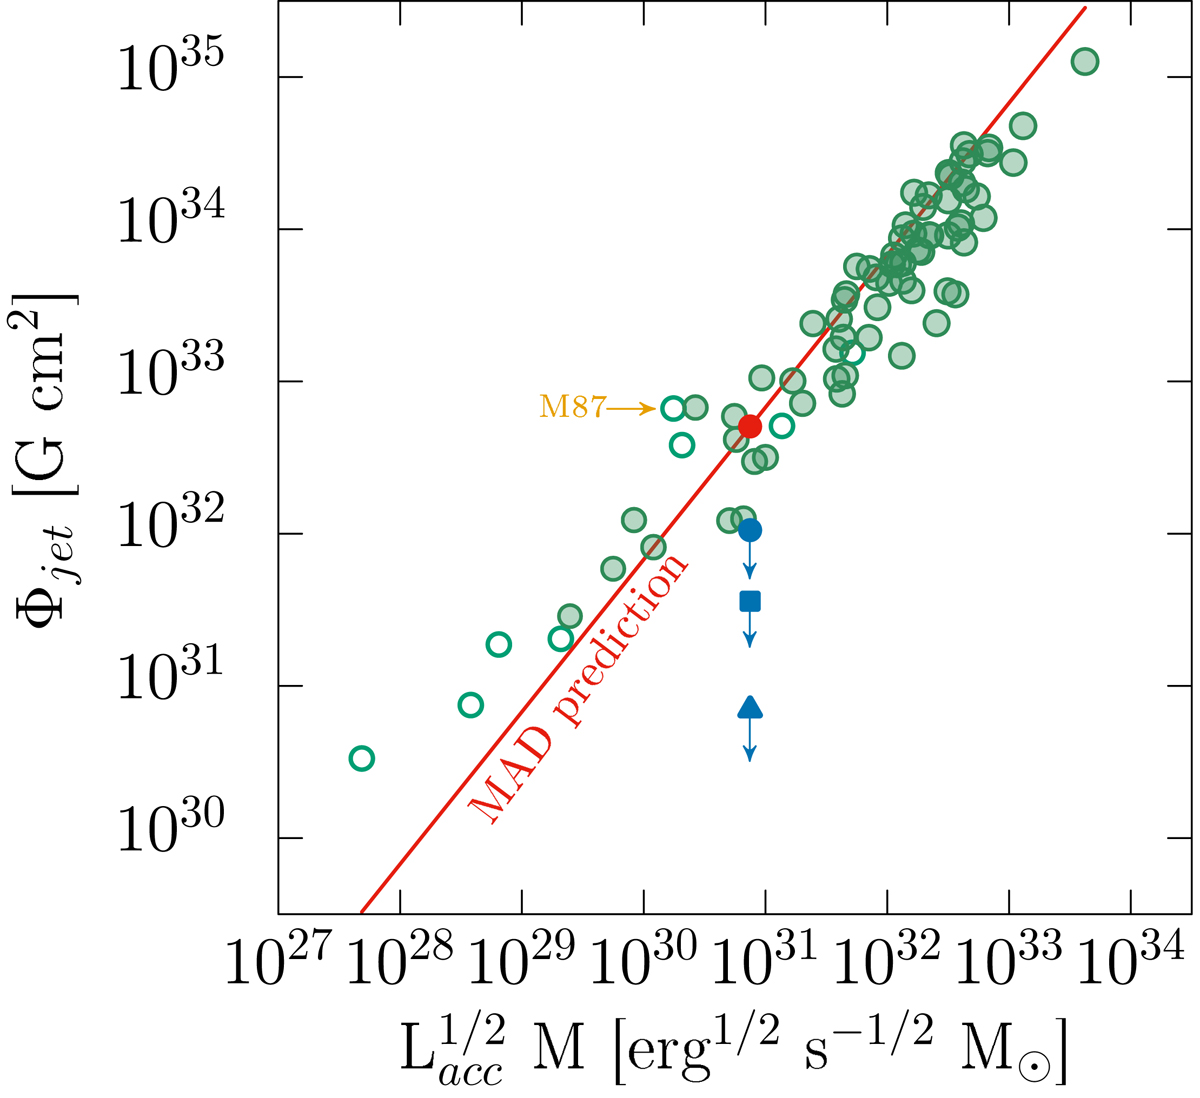
Plot adapted from Zamaninasab et al. (2014). In their work, they assumed Γθj = 1 for the whole sample. The open and filled green circles represent our corrected values with Γθj ≠ 1 for radio galaxies and Γθj = 0.13 for blazars, respectively. The red and blue filled-circles represent the MAD predicted and measured (upper limit in equipartition) values of the jet magnetic flux of IIIZw 2. The blue triangle represents the measured upper limit without equipartition assumption. The blue square represents the measured upper limit from the synchrotron self-absorption magnetic field BSSA.
Current usage metrics show cumulative count of Article Views (full-text article views including HTML views, PDF and ePub downloads, according to the available data) and Abstracts Views on Vision4Press platform.
Data correspond to usage on the plateform after 2015. The current usage metrics is available 48-96 hours after online publication and is updated daily on week days.
Initial download of the metrics may take a while.