Fig. 3.
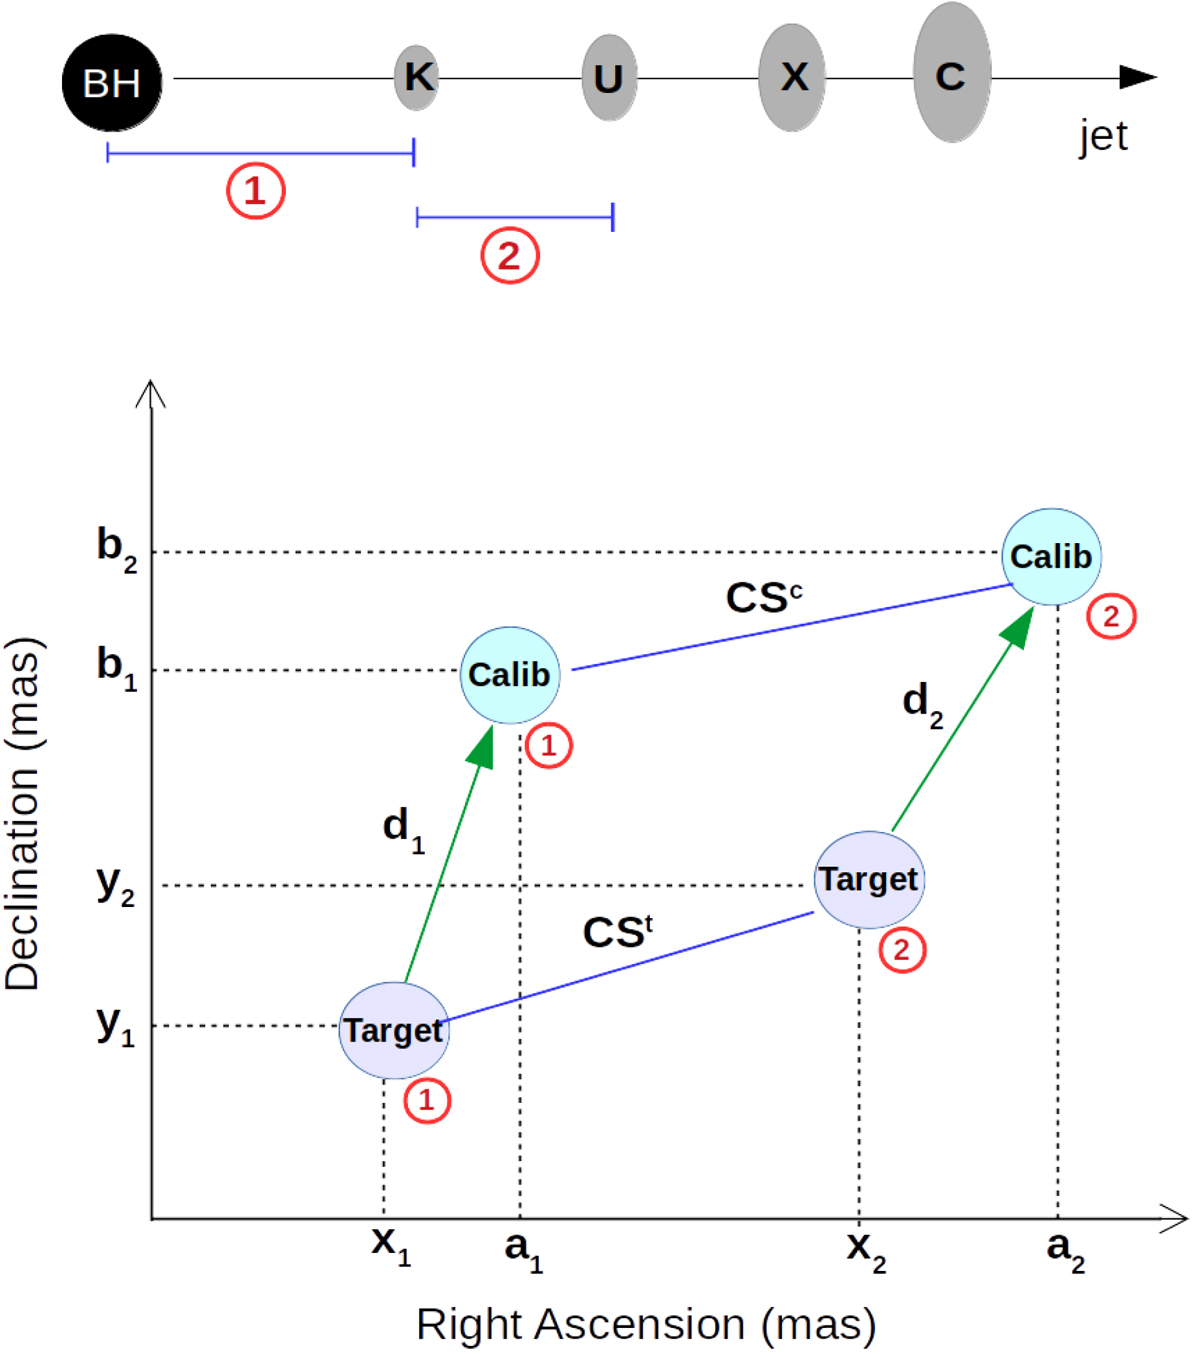
Top: BH (filled black circle) that launches a jet in the horizontal direction. The different core positions at each frequency are shown in ellipses. The K-band core’s distance from the BH is shown with the red circle ‘1’. The distance between the adjacent frequencies K and U bands is shown with the red circle ‘2’. Bottom: schematic diagram describing the phase-referencing positions (d1, d2) and the core shifts of the target (CSt) and a calibrator (CSc). All coordinates are specified for each source.
Current usage metrics show cumulative count of Article Views (full-text article views including HTML views, PDF and ePub downloads, according to the available data) and Abstracts Views on Vision4Press platform.
Data correspond to usage on the plateform after 2015. The current usage metrics is available 48-96 hours after online publication and is updated daily on week days.
Initial download of the metrics may take a while.