Fig. 2.
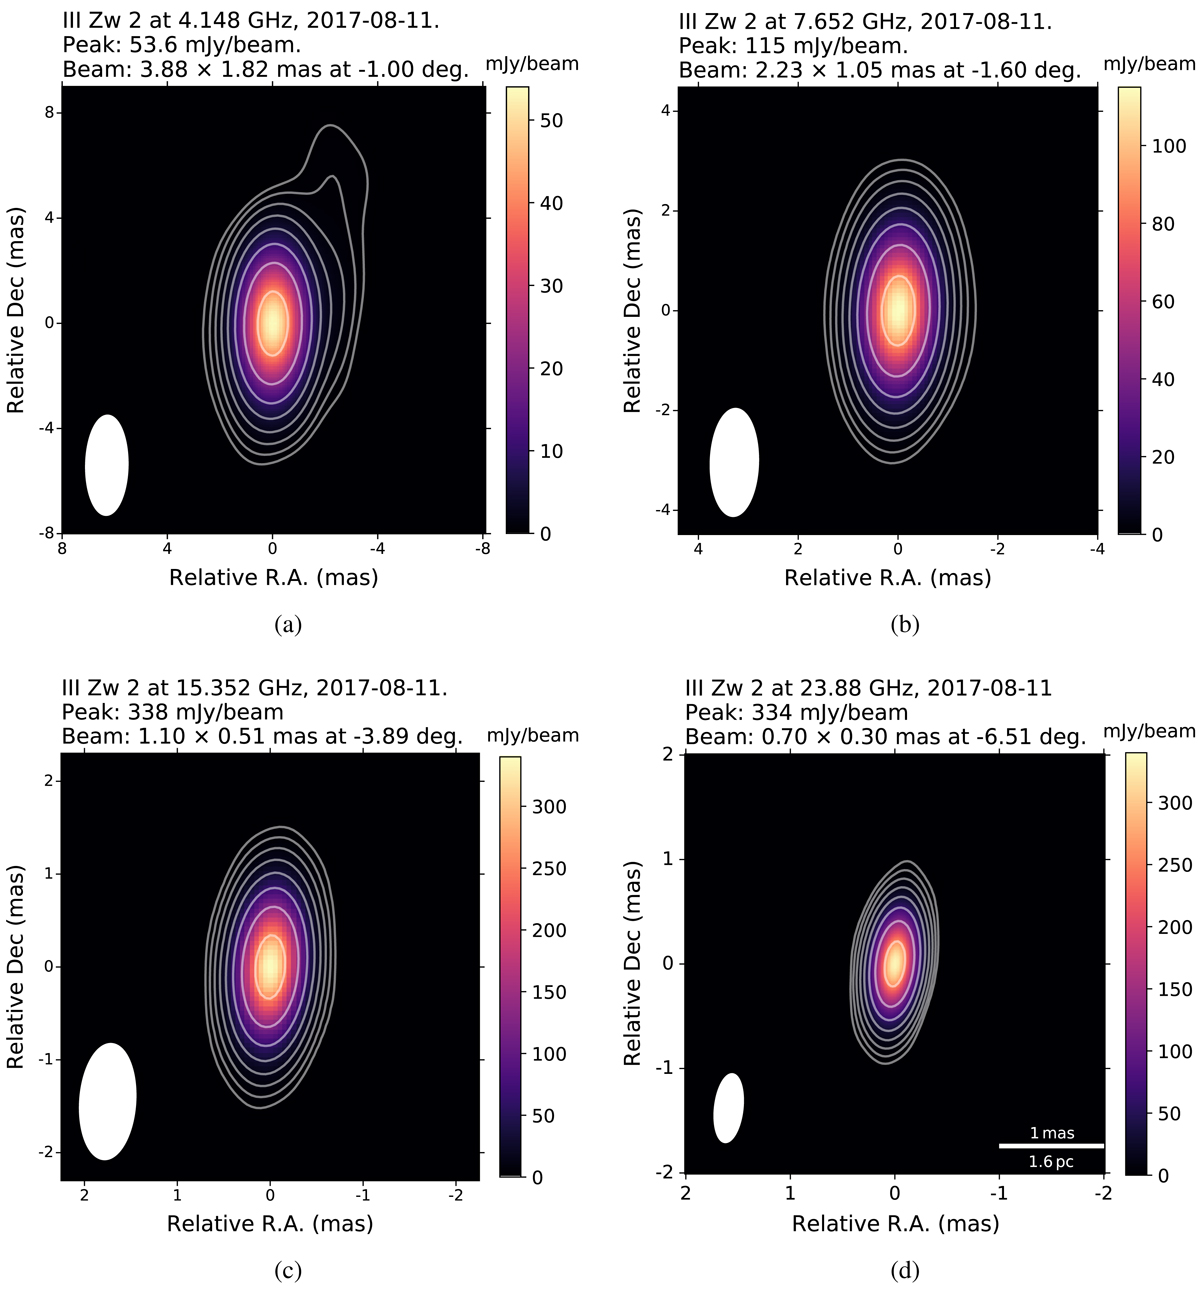
Self-calibrated images of IIIZw 2. The images were obtained at (a) 4.148 GHz, (b) 7.652 GHz, (c) 15.352 GHz and (d) 23.88 GHz. The rms noise level from the lower to the higher frequency is 0.1, 0.1, 0.1 and 0.2 mJy beam−1. The interferometric beam (ellipse) is displayed on the bottom-left corner of each image. Contours represent −0.6%, 0.6%, 1.2%, 2.4%, 4.8%, 9.6%, 19.2%, 38.4%, and 76.8% of the peak intensity at each image.
Current usage metrics show cumulative count of Article Views (full-text article views including HTML views, PDF and ePub downloads, according to the available data) and Abstracts Views on Vision4Press platform.
Data correspond to usage on the plateform after 2015. The current usage metrics is available 48-96 hours after online publication and is updated daily on week days.
Initial download of the metrics may take a while.