Fig. 1.
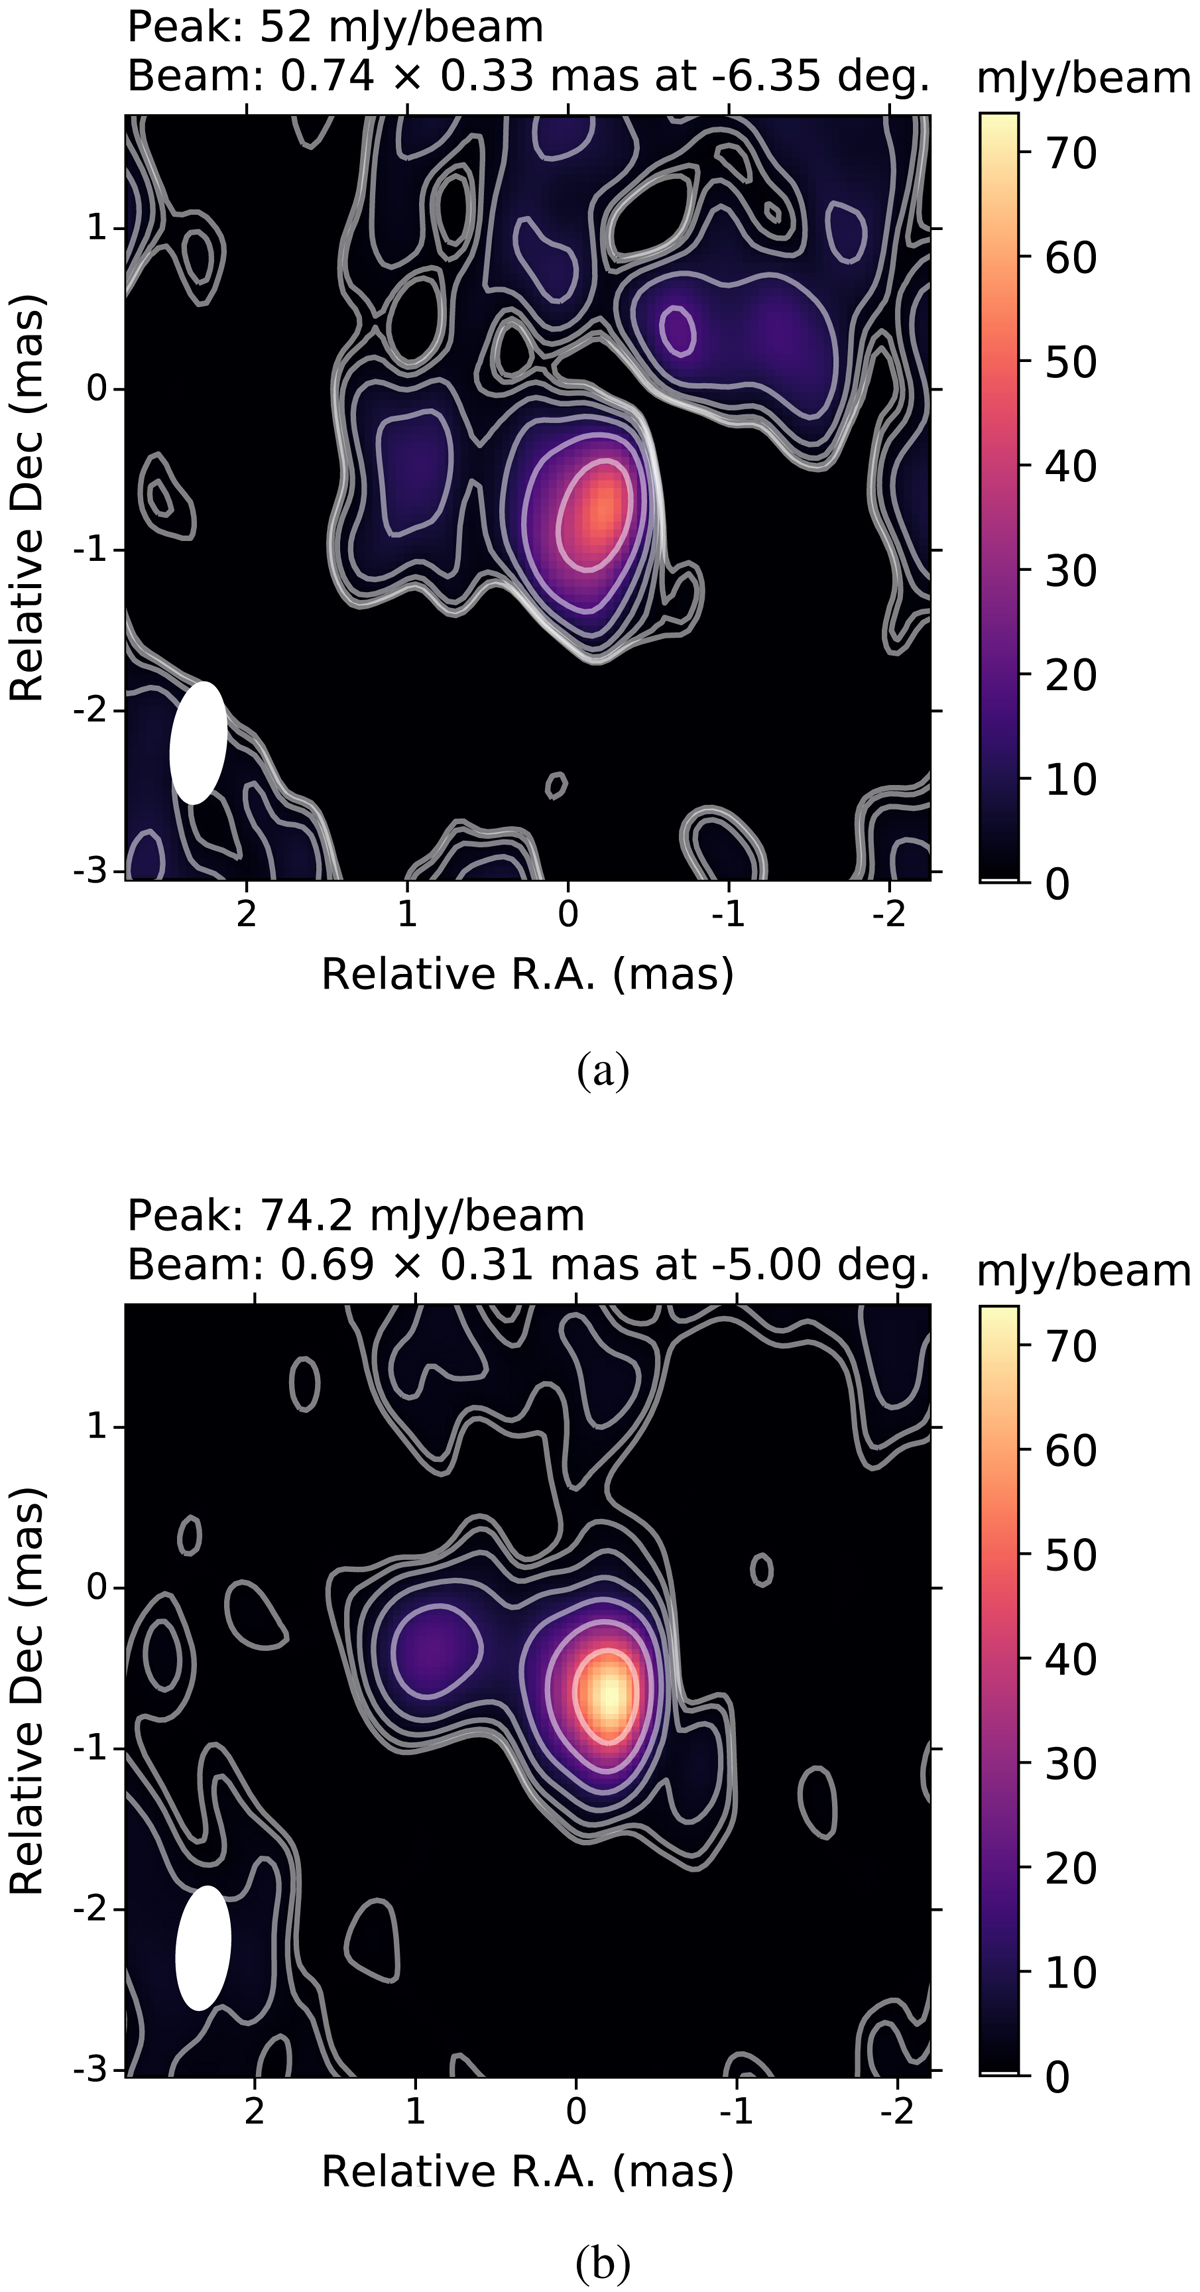
Phase-referenced images of J0006 observed at the K-band after a few CLEAN iterations. (a) The image without troposphere delay corrections has a noise rms of 2.7 mJy beam−1 and (b) the image with troposphere delay corrections has noise rms of 1.3 mJy beam−1. The interferometric beam (ellipse) is displayed on the bottom-left corner of each image. Contours represent 1%, 2%, 4%, 8%, 16%, 32%, and 64% of the peak intensity at each image.
Current usage metrics show cumulative count of Article Views (full-text article views including HTML views, PDF and ePub downloads, according to the available data) and Abstracts Views on Vision4Press platform.
Data correspond to usage on the plateform after 2015. The current usage metrics is available 48-96 hours after online publication and is updated daily on week days.
Initial download of the metrics may take a while.