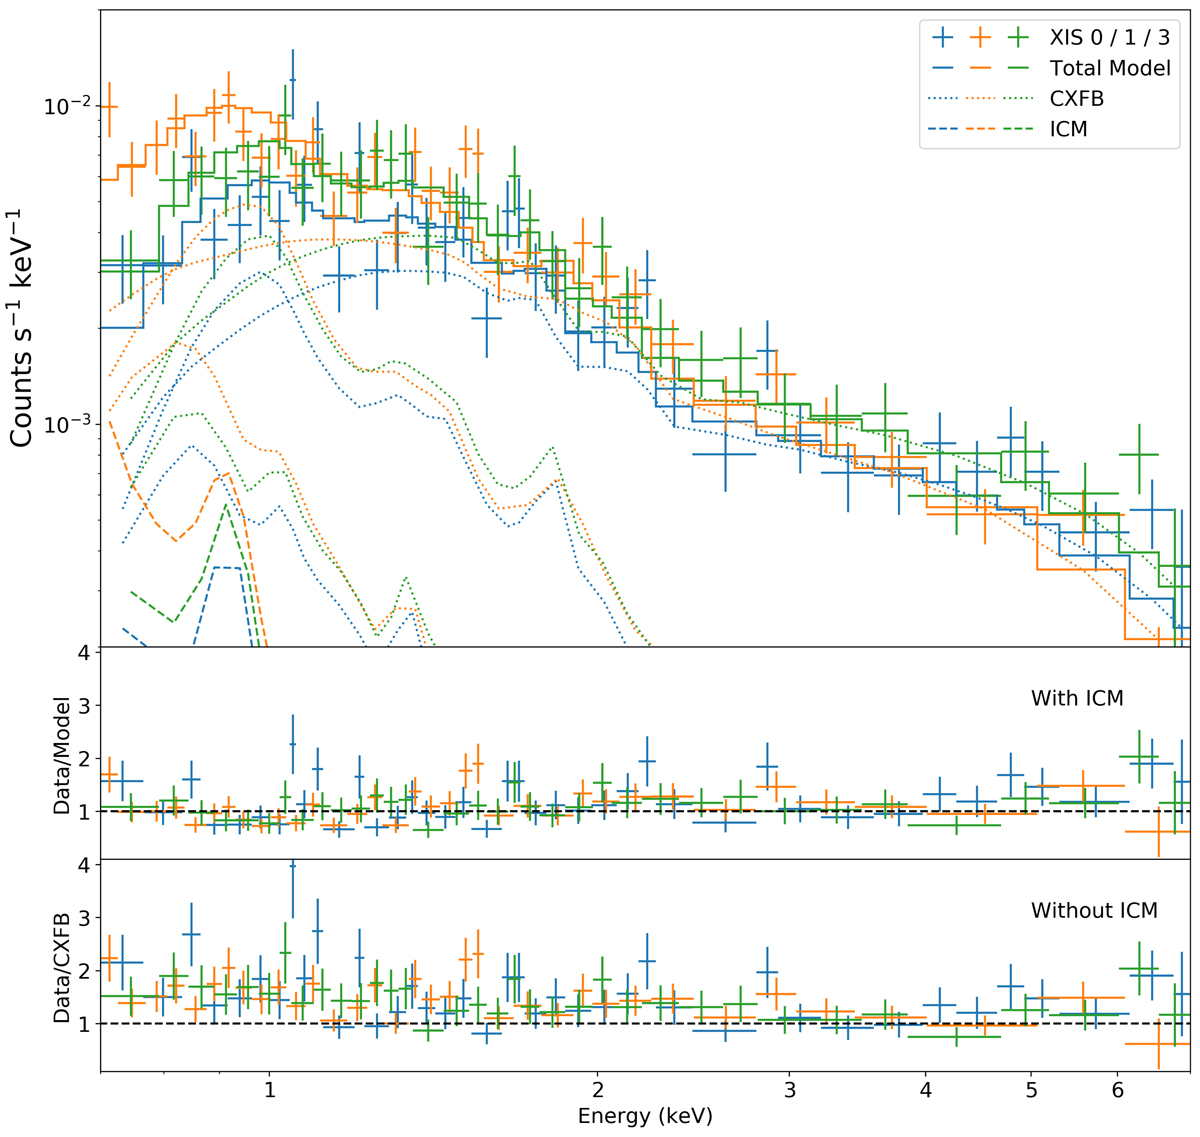
Fig. F.1.
Download original image
Example of 0.7–7 keV spectra and the best-fit models of the first annulus outside r200 (82′< r < 85′) in the NW arm. The best-fit NXB models have been subtracted. Data from all three detectors are shown - XIS0 (blue), XIS1 (yellow) and XIS3 (green). The CXFB models are marked with dotted lines and ICM models are denoted with dashed lines. The data has been rebinned to S/N≥3 for illustration purpose, while the fit was performed on the data binned with a minimum of one count. The lower two panels show the fitting residuals including and excluding the ICM component respectively.
Current usage metrics show cumulative count of Article Views (full-text article views including HTML views, PDF and ePub downloads, according to the available data) and Abstracts Views on Vision4Press platform.
Data correspond to usage on the plateform after 2015. The current usage metrics is available 48-96 hours after online publication and is updated daily on week days.
Initial download of the metrics may take a while.