Free Access
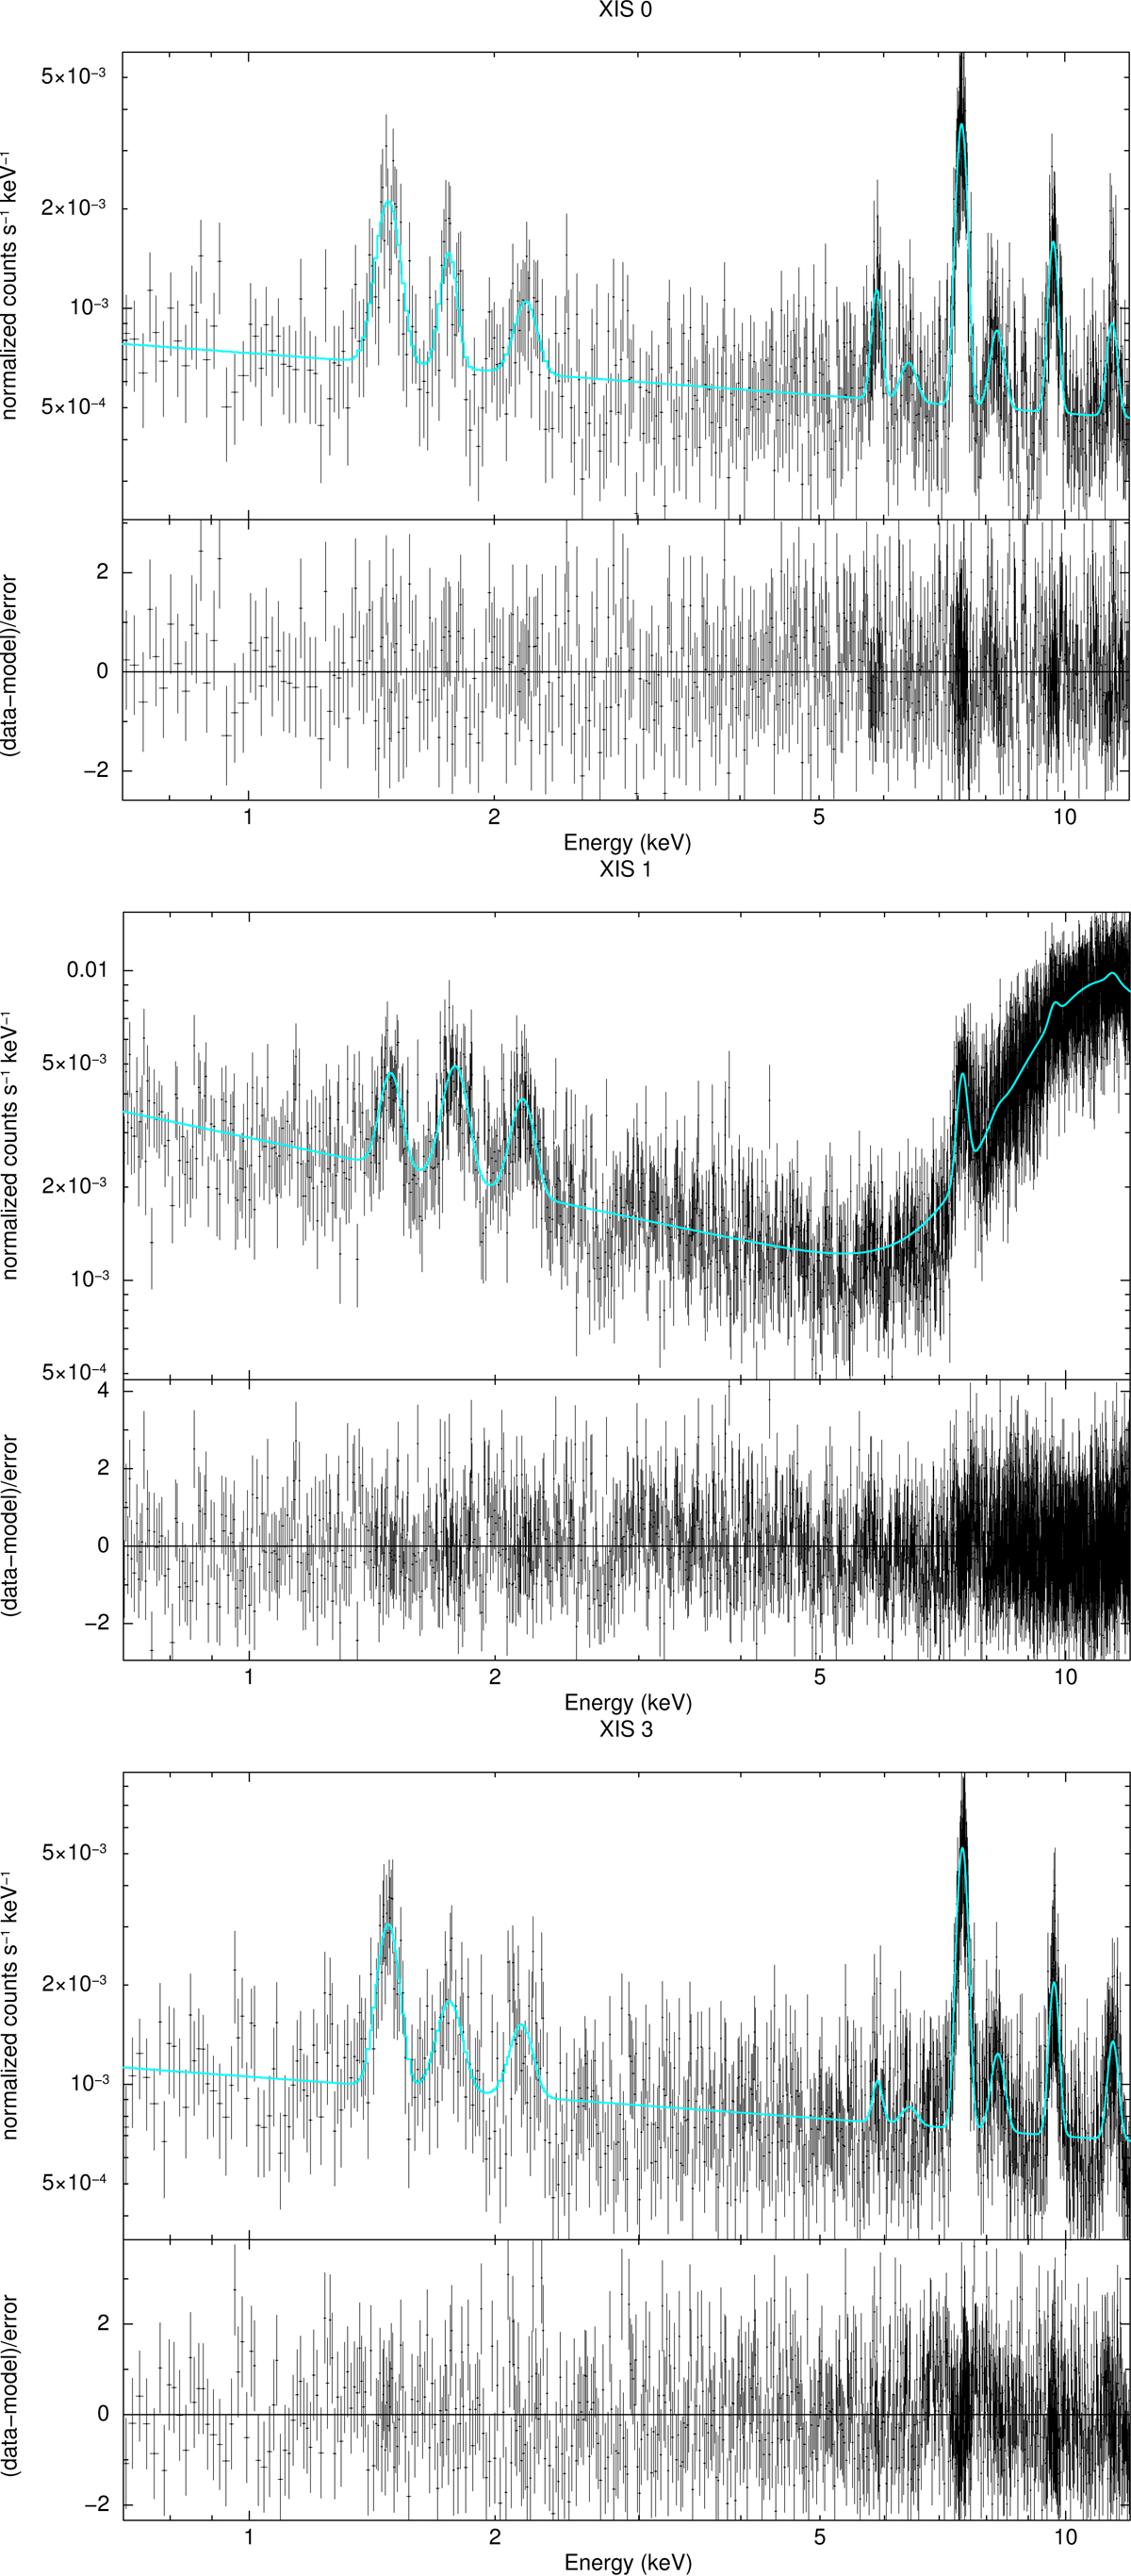
Fig. D.1.
Download original image
The typical NXB spectrum of each XIS sensor created by xisnxbgen. The best-fit models are denoted with cyan lines. The data has been rebinned to S/N≥3 for plotting purpose, while the fit was performed on the data optimally binned using the obin command (Kaastra & Bleeker 2016).
Current usage metrics show cumulative count of Article Views (full-text article views including HTML views, PDF and ePub downloads, according to the available data) and Abstracts Views on Vision4Press platform.
Data correspond to usage on the plateform after 2015. The current usage metrics is available 48-96 hours after online publication and is updated daily on week days.
Initial download of the metrics may take a while.