Fig. 3.
Download original image
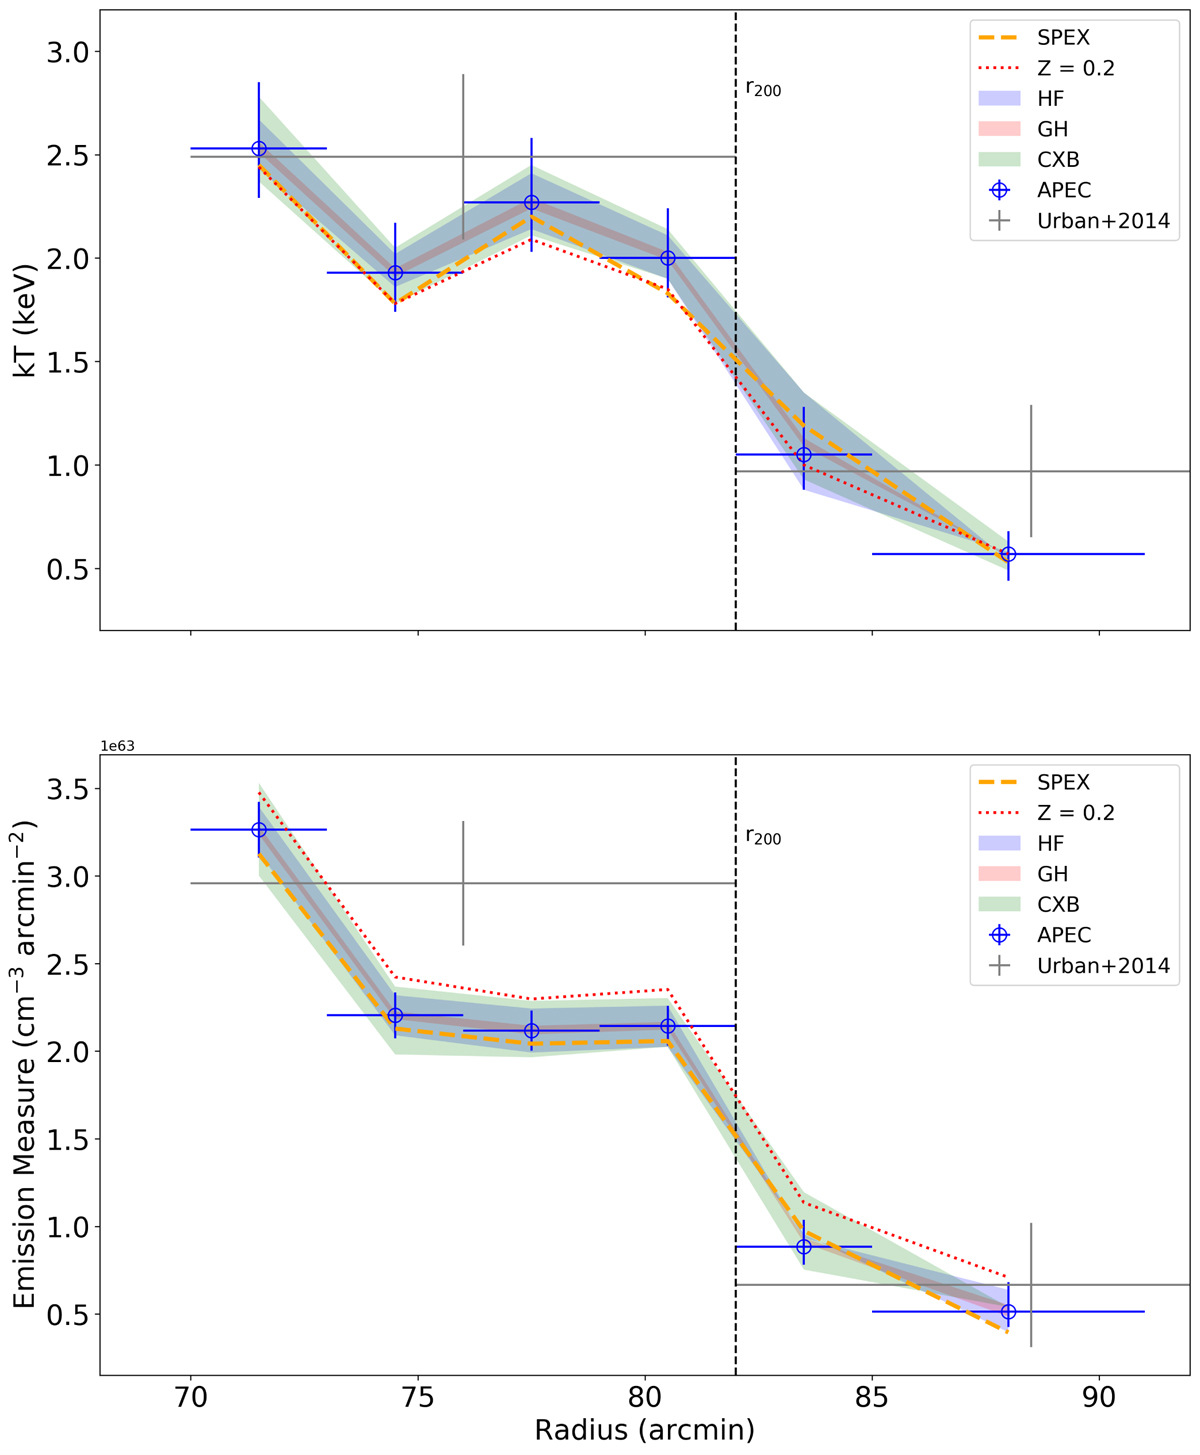
Profiles of the measured thermodynamic properties. Top: projected temperature profile; bottom: emission measure (EM = ∫nenHdV) profile. The grey crosses show measurements presented in Urban et al. (2014), using a shallower data set. The colored bands show the systematic uncertainties of the measurements due to the Milky Way foreground and the CXB (see Sect. 3.2 for details). Further systematic uncertainties due to the assumed metallicity and atomic code are shown with red and orange lines, respectively.
Current usage metrics show cumulative count of Article Views (full-text article views including HTML views, PDF and ePub downloads, according to the available data) and Abstracts Views on Vision4Press platform.
Data correspond to usage on the plateform after 2015. The current usage metrics is available 48-96 hours after online publication and is updated daily on week days.
Initial download of the metrics may take a while.