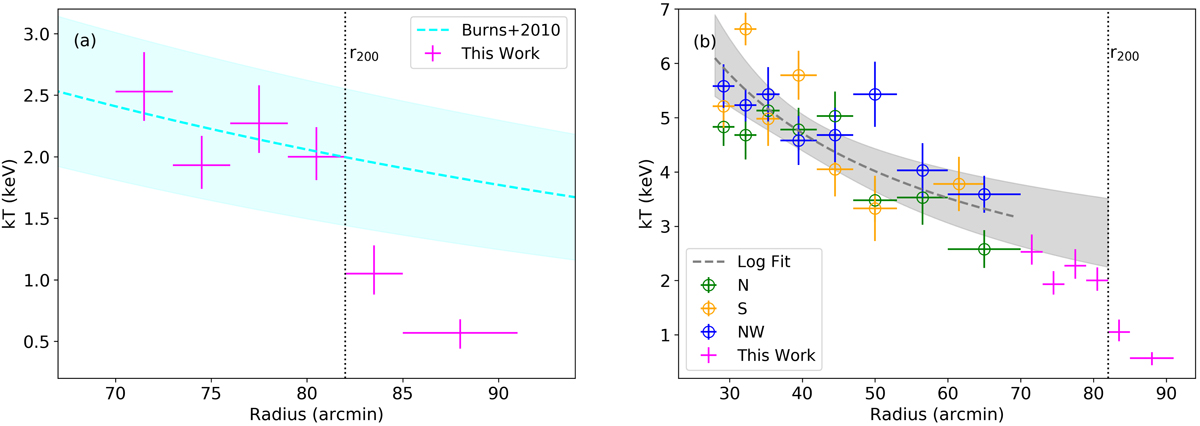
Fig. 2.
Download original image
Projected temperature measurements (magenta points). (a) The overlaid cyan dashed line represents the prediction from the cosmological simulation (Burns et al. 2010). (b) We selected the measured temperatures of the three relaxed arms (i.e., NW, N and S) from Urban et al. (2014), from 28′ to 70′, and fitted with a power-law. The grey dashed line shows the best-fit curve. All the shaded regions represent the uncertainty at 68% confidence level.
Current usage metrics show cumulative count of Article Views (full-text article views including HTML views, PDF and ePub downloads, according to the available data) and Abstracts Views on Vision4Press platform.
Data correspond to usage on the plateform after 2015. The current usage metrics is available 48-96 hours after online publication and is updated daily on week days.
Initial download of the metrics may take a while.