Fig. 6.
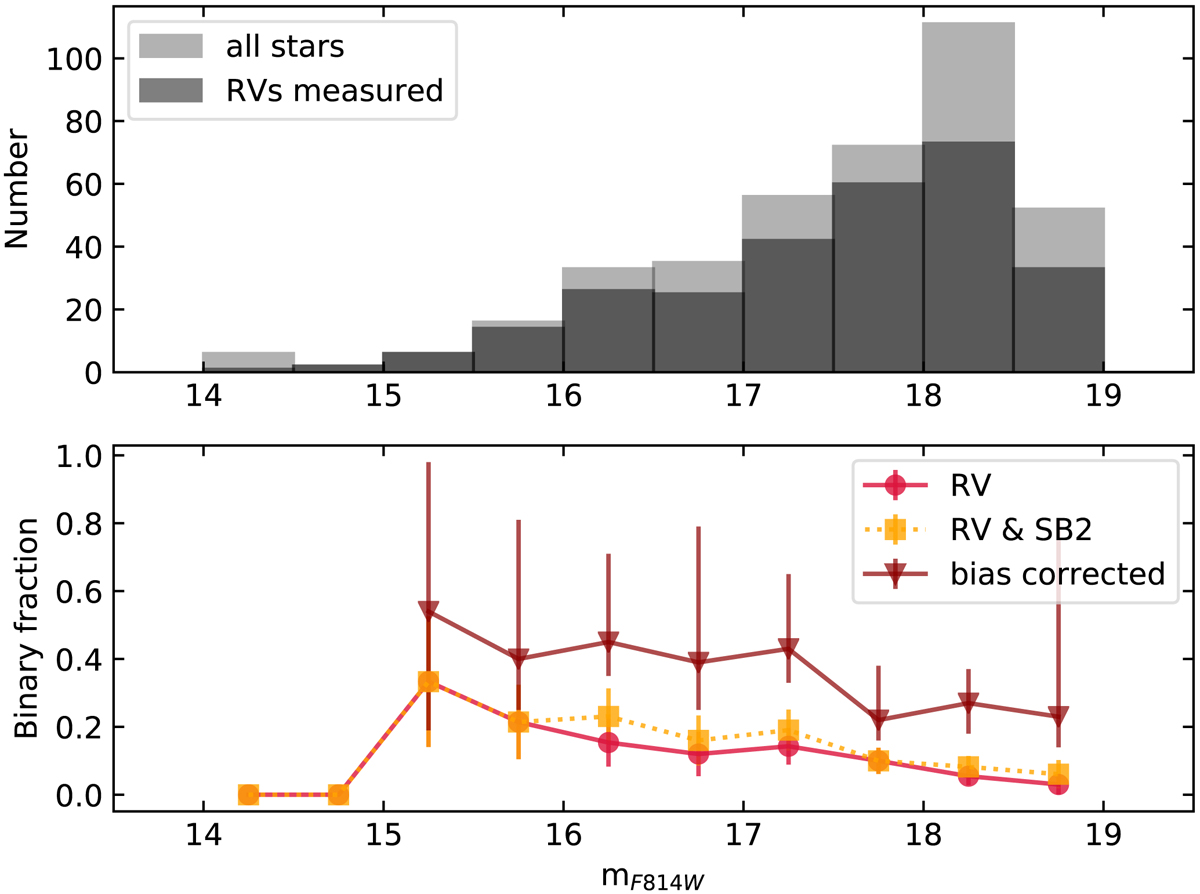
Distribution of F814W magnitudes and observed close binary fraction for B and Be stars. Top panel: distribution of F814W magnitudes of all stars for which spectra were extracted (dim gray), and stars for which RVs were measured (dark gray). Bottom panel: observed spectroscopic binary fraction as a function of F814W magnitude. The orange curve is based on RV measurements, and the red curve is based on RV measurements as well as SB2s. The bias-corrected close binary fraction is overplotted in dark red.
Current usage metrics show cumulative count of Article Views (full-text article views including HTML views, PDF and ePub downloads, according to the available data) and Abstracts Views on Vision4Press platform.
Data correspond to usage on the plateform after 2015. The current usage metrics is available 48-96 hours after online publication and is updated daily on week days.
Initial download of the metrics may take a while.