Fig. 5.
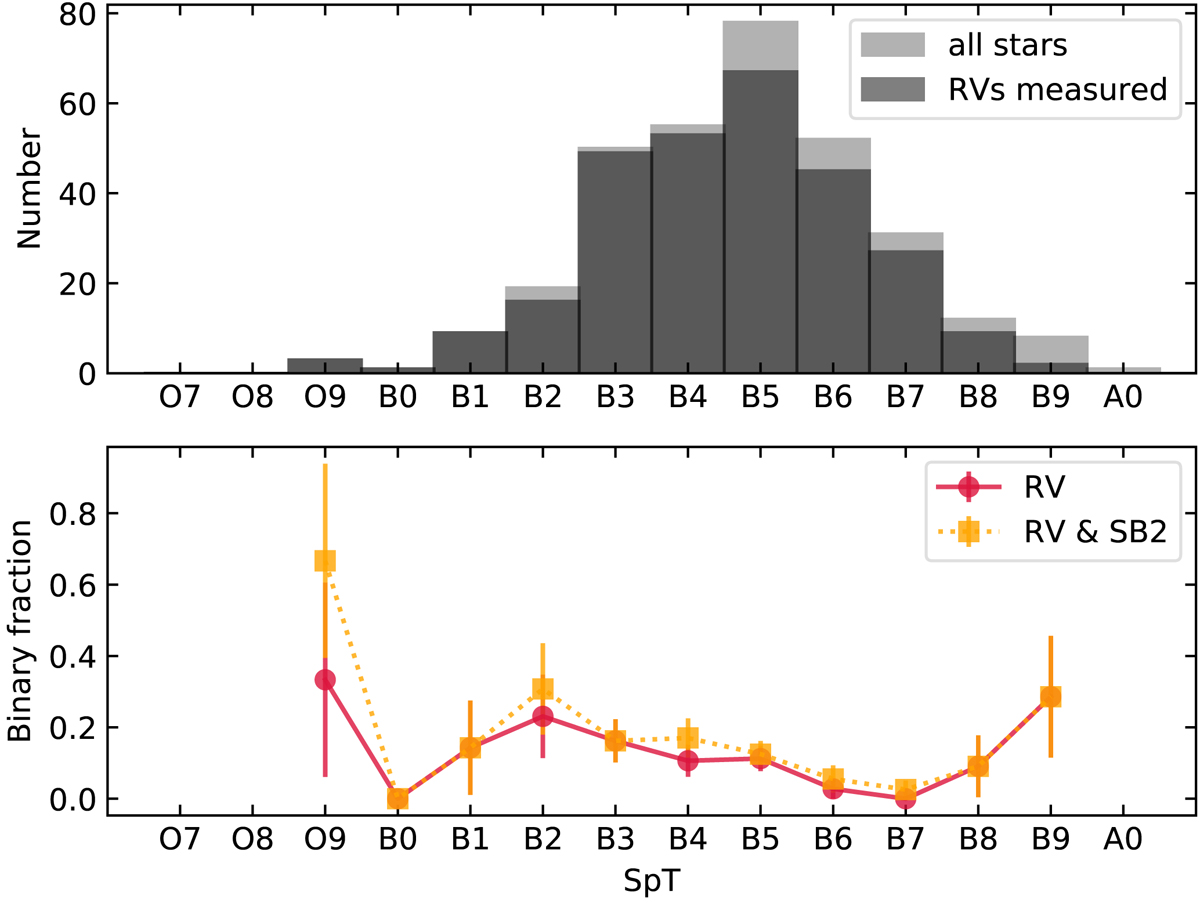
Distribution of spectral types and observed close binary fraction for B and Be stars. Top panel: distribution of spectral types for all MS stars (dim gray) and stars for which RVs were measured (dark gray). Bottom panel: observed spectroscopic binary fraction as a function of spectral type. The red curves indicate the binary fraction inferred from the RV measurements, and the orange curve combines the RV measurements with the SB2s found by visual inspection.
Current usage metrics show cumulative count of Article Views (full-text article views including HTML views, PDF and ePub downloads, according to the available data) and Abstracts Views on Vision4Press platform.
Data correspond to usage on the plateform after 2015. The current usage metrics is available 48-96 hours after online publication and is updated daily on week days.
Initial download of the metrics may take a while.