Fig. 2.
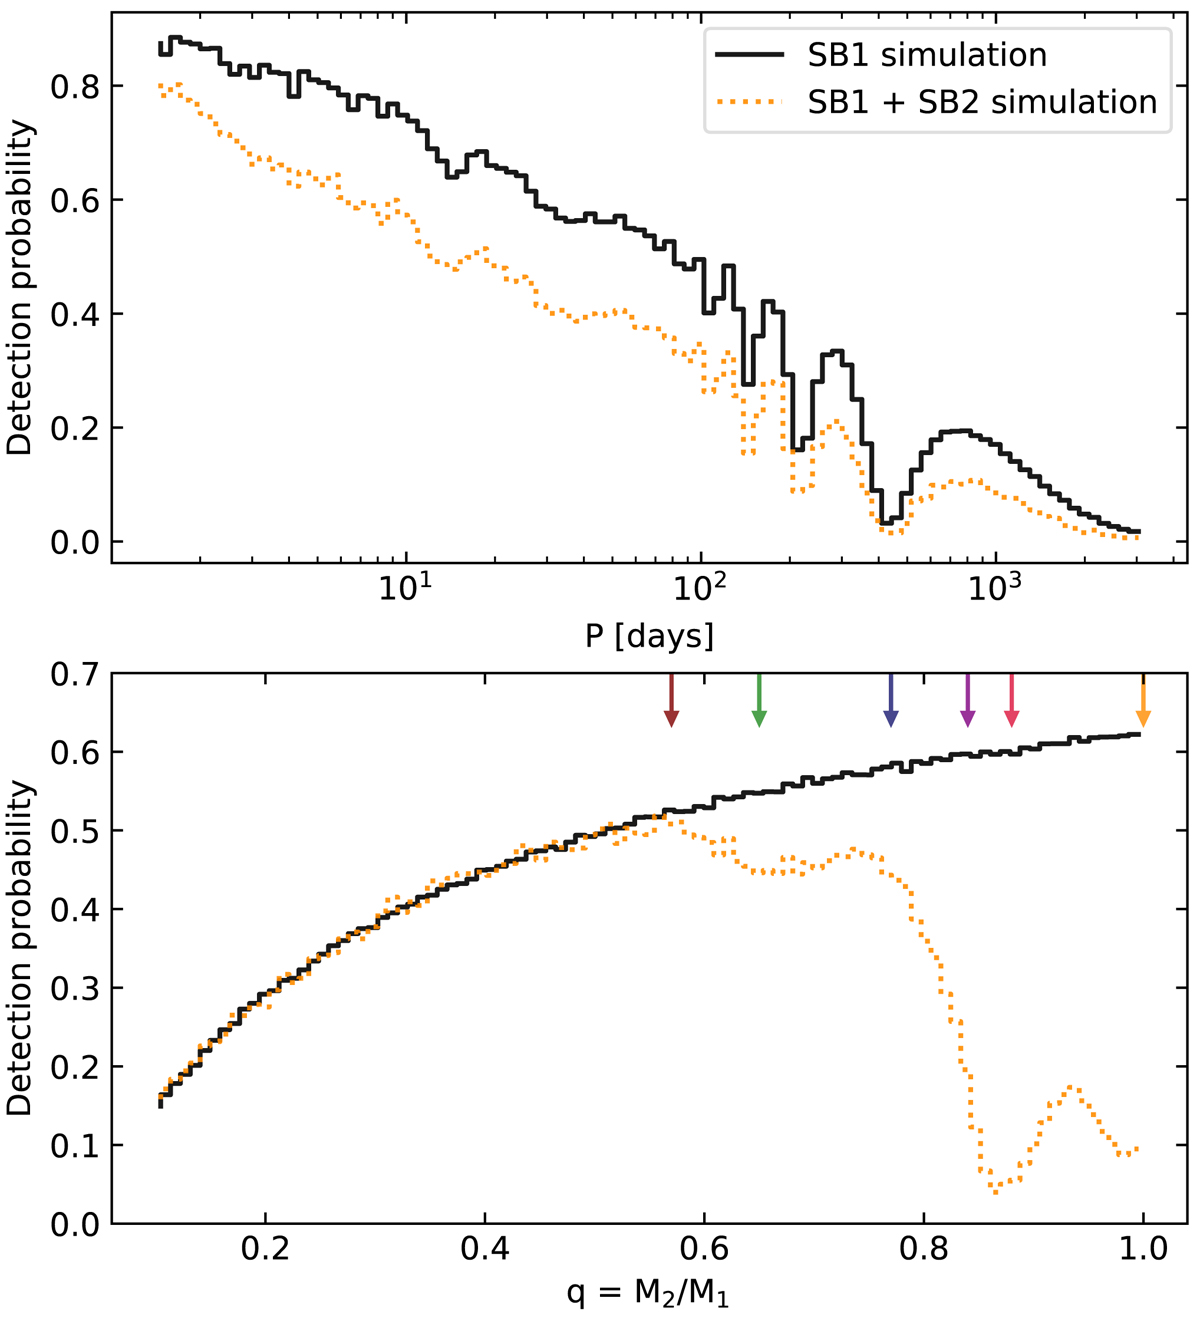
Binary detection probability simulations following our observational setup. Top panel: detection probability as a function of the orbital period P (computed assuming a flat mass-ratio distribution), and bottom panel: this as a function of mass ratio q (computed assuming a flat logP distribution). In both panels, the black line shows our first estimate of the binary detection probability taking the SB1 bias into account, and the orange line shows the detection probability, which also includes the reduced sensitivity for detecting near equal-mass binaries. The colored arrows in the bottom panel correspond to the mass ratio for which we compute the SB2 bias (see Fig. 3).
Current usage metrics show cumulative count of Article Views (full-text article views including HTML views, PDF and ePub downloads, according to the available data) and Abstracts Views on Vision4Press platform.
Data correspond to usage on the plateform after 2015. The current usage metrics is available 48-96 hours after online publication and is updated daily on week days.
Initial download of the metrics may take a while.