Fig. B.1.
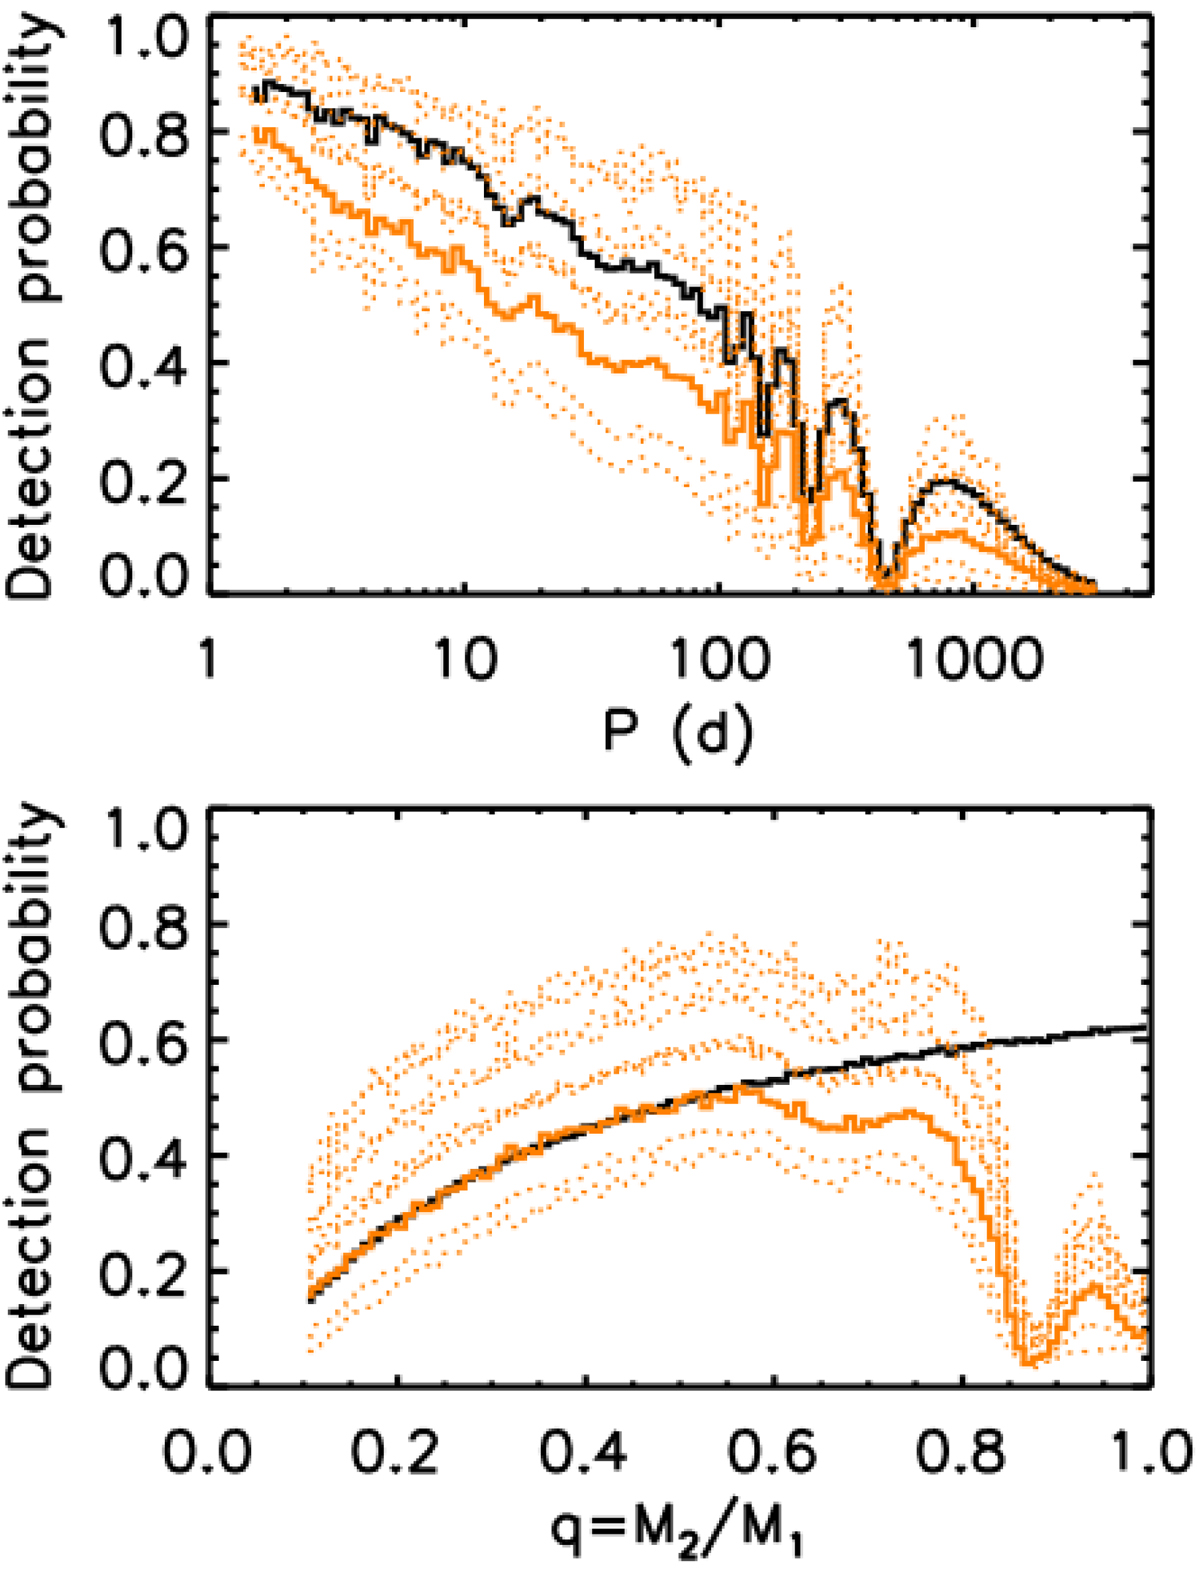
Binary detection probability as a function of period (top panel) and mass ratio (bottom panel). The different dotted orange curves correspond to different magnitude bins, in which the detection probability is highest for the brightest stars. The continuous orange line shows the overall detection probability for the full simulation, and the continuous black line shows the detection probability for the SB1 bias alone (see Sect. 4.1).
Current usage metrics show cumulative count of Article Views (full-text article views including HTML views, PDF and ePub downloads, according to the available data) and Abstracts Views on Vision4Press platform.
Data correspond to usage on the plateform after 2015. The current usage metrics is available 48-96 hours after online publication and is updated daily on week days.
Initial download of the metrics may take a while.