Fig. 8
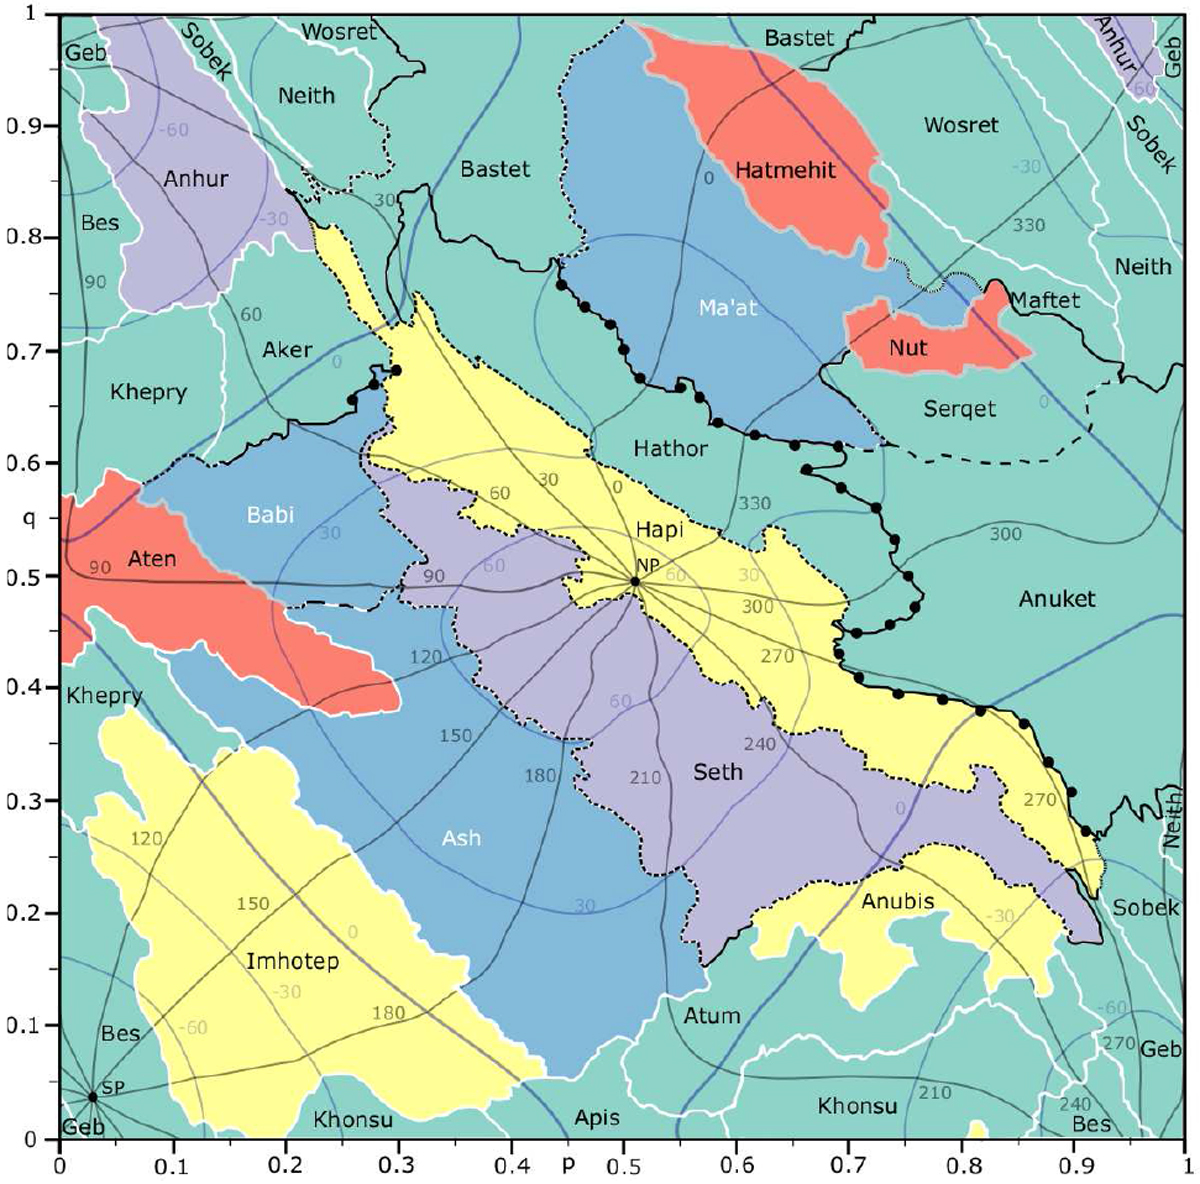
North-centred QuACK projection. Black boundaries indicate the border type of the regions with longitude or latitude ambiguities. The original coordinate grid is represented on top. Purple: original latitude. Grey: original longitude. Colours and line styles correspond to the legend in Fig. 6. Axis annotations show the QuACK map coordinates p and q.
Current usage metrics show cumulative count of Article Views (full-text article views including HTML views, PDF and ePub downloads, according to the available data) and Abstracts Views on Vision4Press platform.
Data correspond to usage on the plateform after 2015. The current usage metrics is available 48-96 hours after online publication and is updated daily on week days.
Initial download of the metrics may take a while.