Free Access
Fig. 2
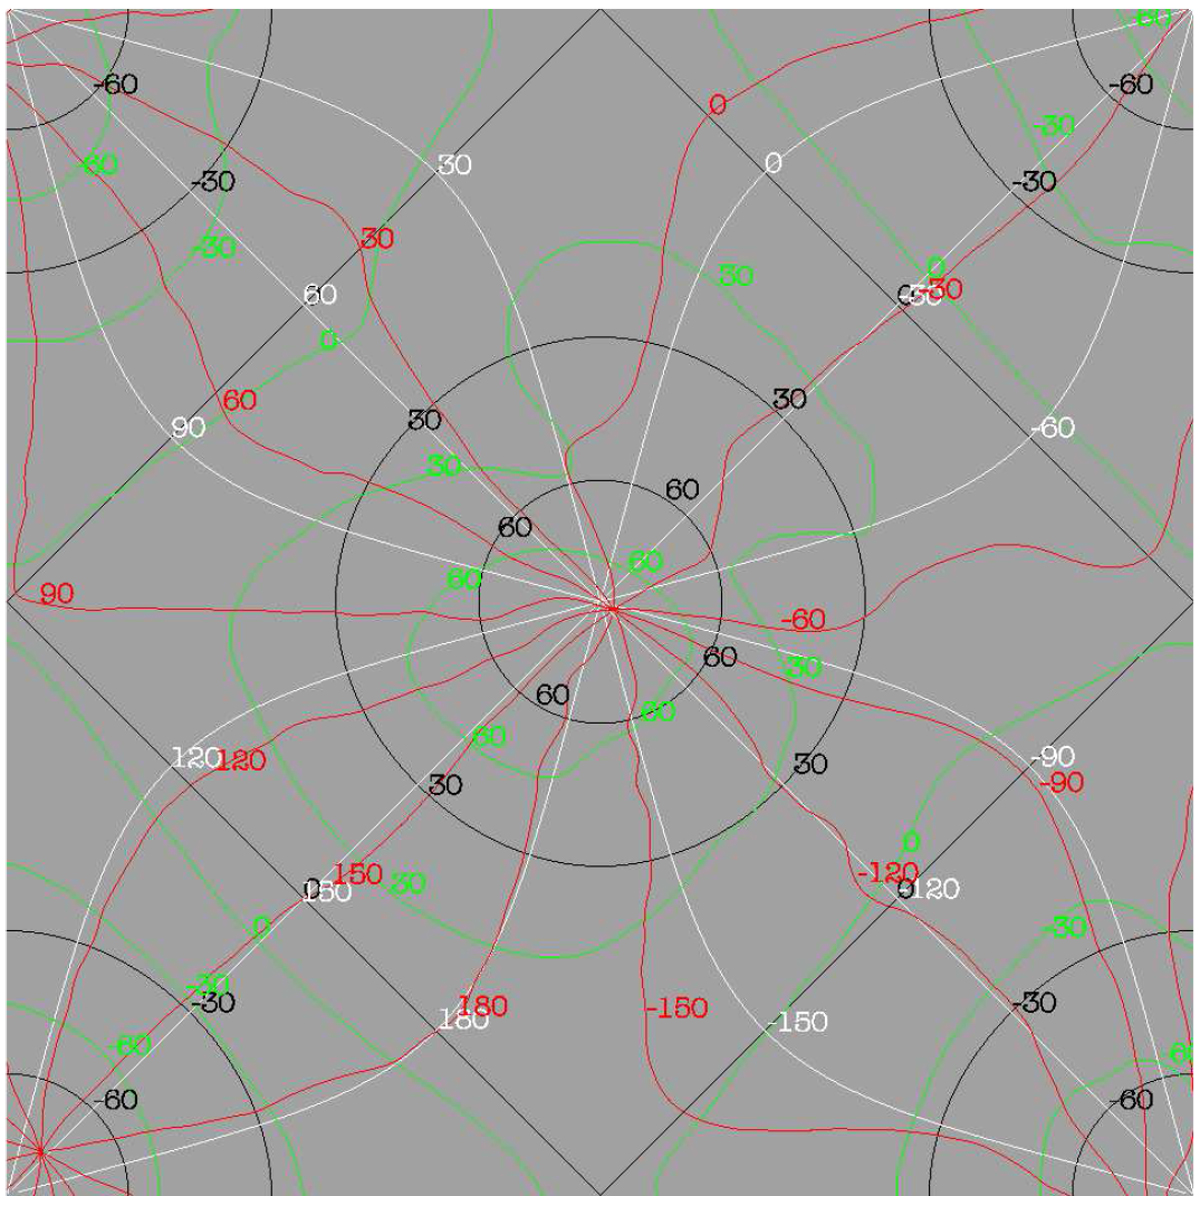
QuACK map projection with longitudes and latitudes. Red and green: original longitudes and latitudes, respectively, as directly computed from the three-dimensional surface points of 67P. White and black: generalised longitudes and latitudes, respectively, assigned to each surface point via the QuACK map.
Current usage metrics show cumulative count of Article Views (full-text article views including HTML views, PDF and ePub downloads, according to the available data) and Abstracts Views on Vision4Press platform.
Data correspond to usage on the plateform after 2015. The current usage metrics is available 48-96 hours after online publication and is updated daily on week days.
Initial download of the metrics may take a while.