Free Access
Fig. 19
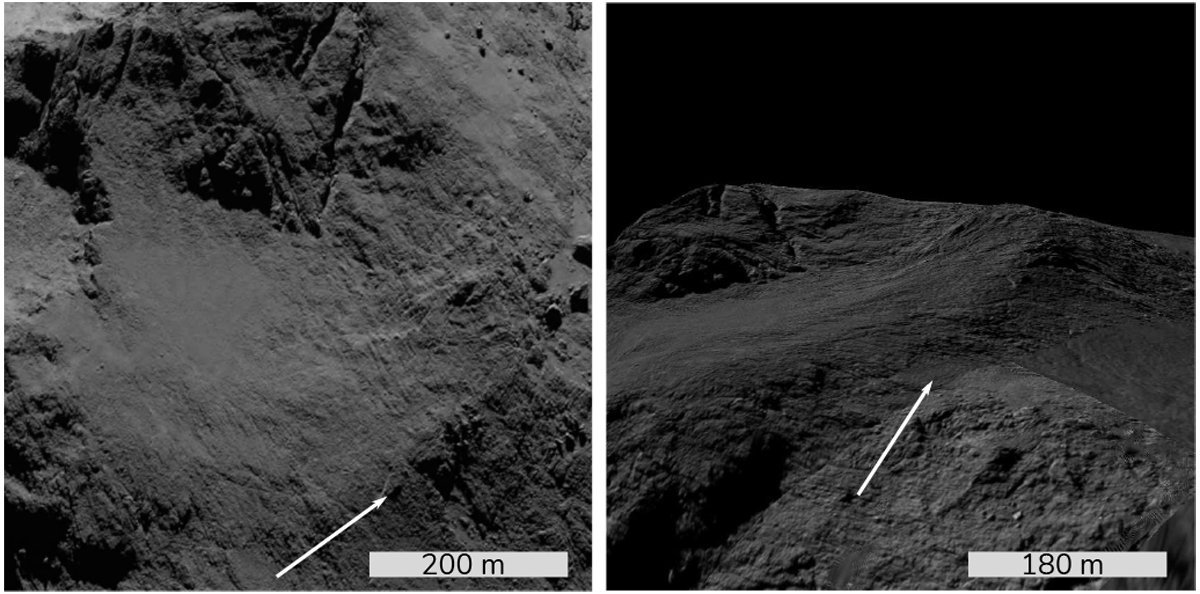
Example of two-dimensional versus three-dimensional image visualisation. Left: close view of a ridge in the Aker region on an OSIRIS NAC image. Right: oriented view of the ridge projected onto the comet surface with the SBMT. White arrows mark the ridge location.
Current usage metrics show cumulative count of Article Views (full-text article views including HTML views, PDF and ePub downloads, according to the available data) and Abstracts Views on Vision4Press platform.
Data correspond to usage on the plateform after 2015. The current usage metrics is available 48-96 hours after online publication and is updated daily on week days.
Initial download of the metrics may take a while.