Fig. 9.
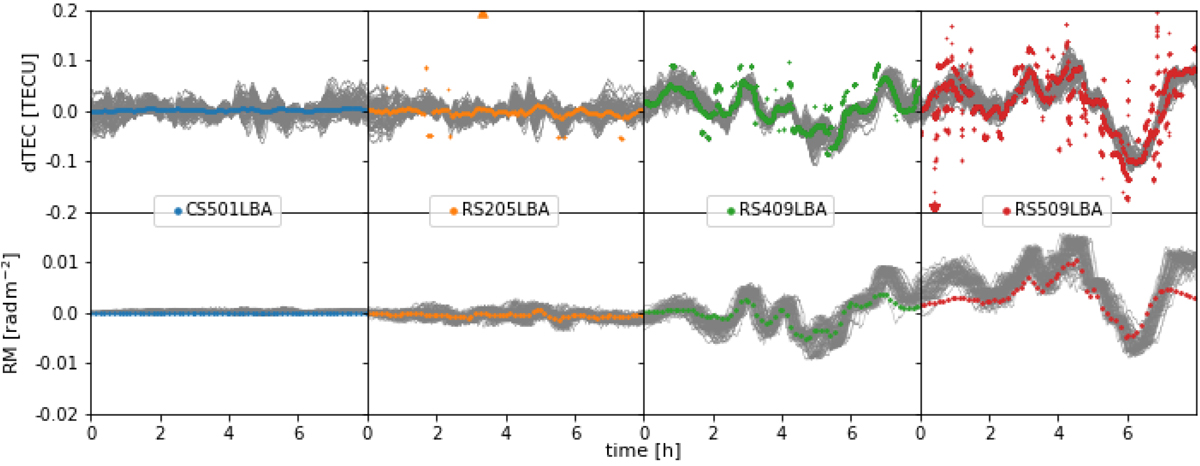
Direction-independent ionospheric solutions towards the target field for four LBA stations. Top panels: dTEC, the bottom panels dRM. The gray curves in the background show the input corruptions towards the 59 patches. The calibration solutions are referenced to station CS001LBA and the input corruptions are referenced to the phase center direction of CS001LBA. Triangles mark solutions outside of the graph’s scale. We note that the missing variation of the input-RM for CS001 is caused by a referencing error present in the data. Simulated RM values were referenced for each direction individually instead of referencing to a single direction. However, we do not expect this to affect our analysis.
Current usage metrics show cumulative count of Article Views (full-text article views including HTML views, PDF and ePub downloads, according to the available data) and Abstracts Views on Vision4Press platform.
Data correspond to usage on the plateform after 2015. The current usage metrics is available 48-96 hours after online publication and is updated daily on week days.
Initial download of the metrics may take a while.