Fig. 8.
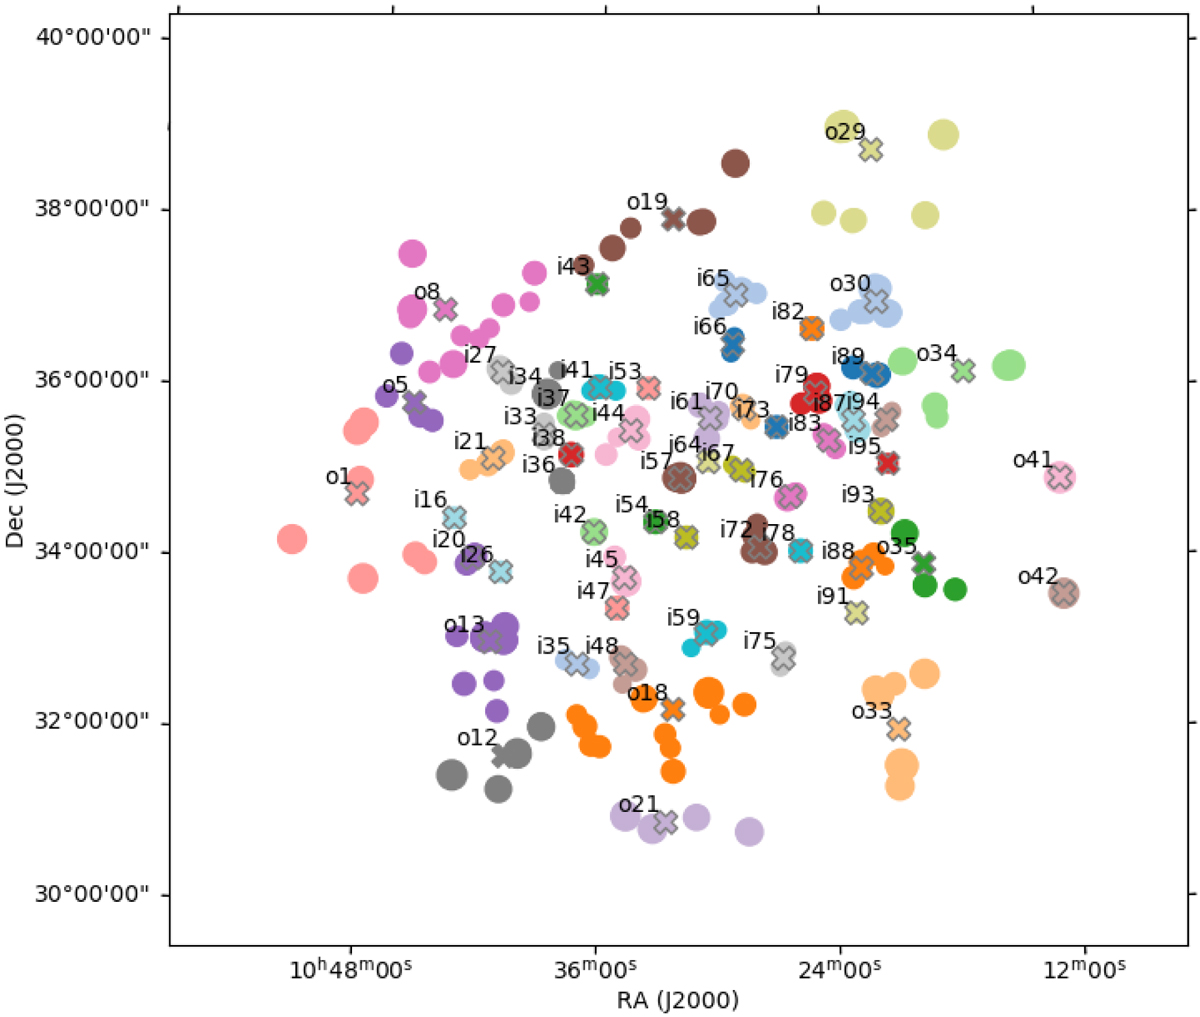
Input sky model of the simulation. The model is extracted from a real LOFAR observation of the target field. It contains 340 sources grouped into 59 patches, the total flux density is 226 Jy at 56 MHz. Circles correspond to source locations. Sources are color-coded according to their patch membership, patch centers are marked by an “X” and labeled.
Current usage metrics show cumulative count of Article Views (full-text article views including HTML views, PDF and ePub downloads, according to the available data) and Abstracts Views on Vision4Press platform.
Data correspond to usage on the plateform after 2015. The current usage metrics is available 48-96 hours after online publication and is updated daily on week days.
Initial download of the metrics may take a while.