Fig. 15.
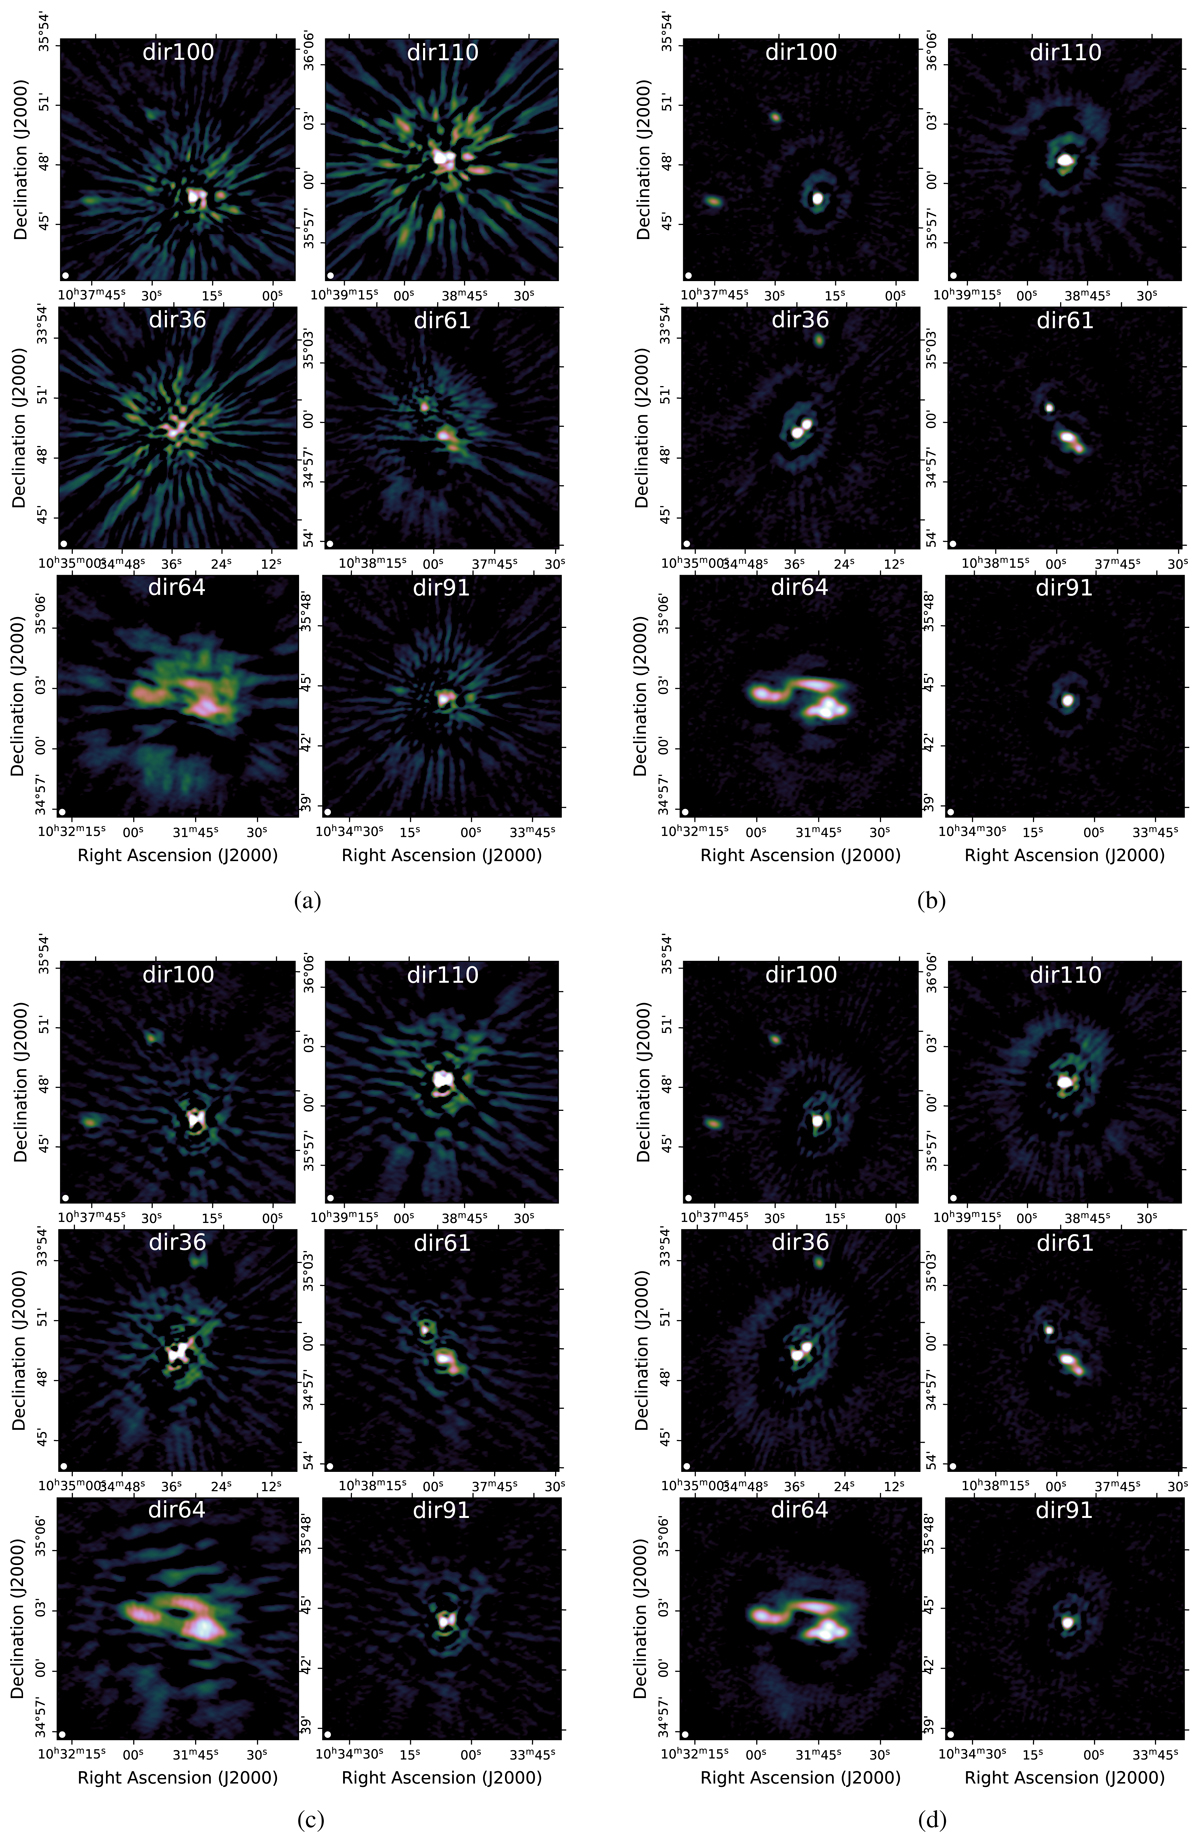
12″-region around the six calibrator directions used in the analysis with different calibration solutions applied shown in panels a–d. All images share the same color scale and show LBA data centered at 54 MHz. Panel a: is corrected only for direction-independent effects, panels b and c: are corrected using TEC-solutions derived from only LBA or only HBA, and panel d: joint-calibration case.
Current usage metrics show cumulative count of Article Views (full-text article views including HTML views, PDF and ePub downloads, according to the available data) and Abstracts Views on Vision4Press platform.
Data correspond to usage on the plateform after 2015. The current usage metrics is available 48-96 hours after online publication and is updated daily on week days.
Initial download of the metrics may take a while.