Fig. 13.
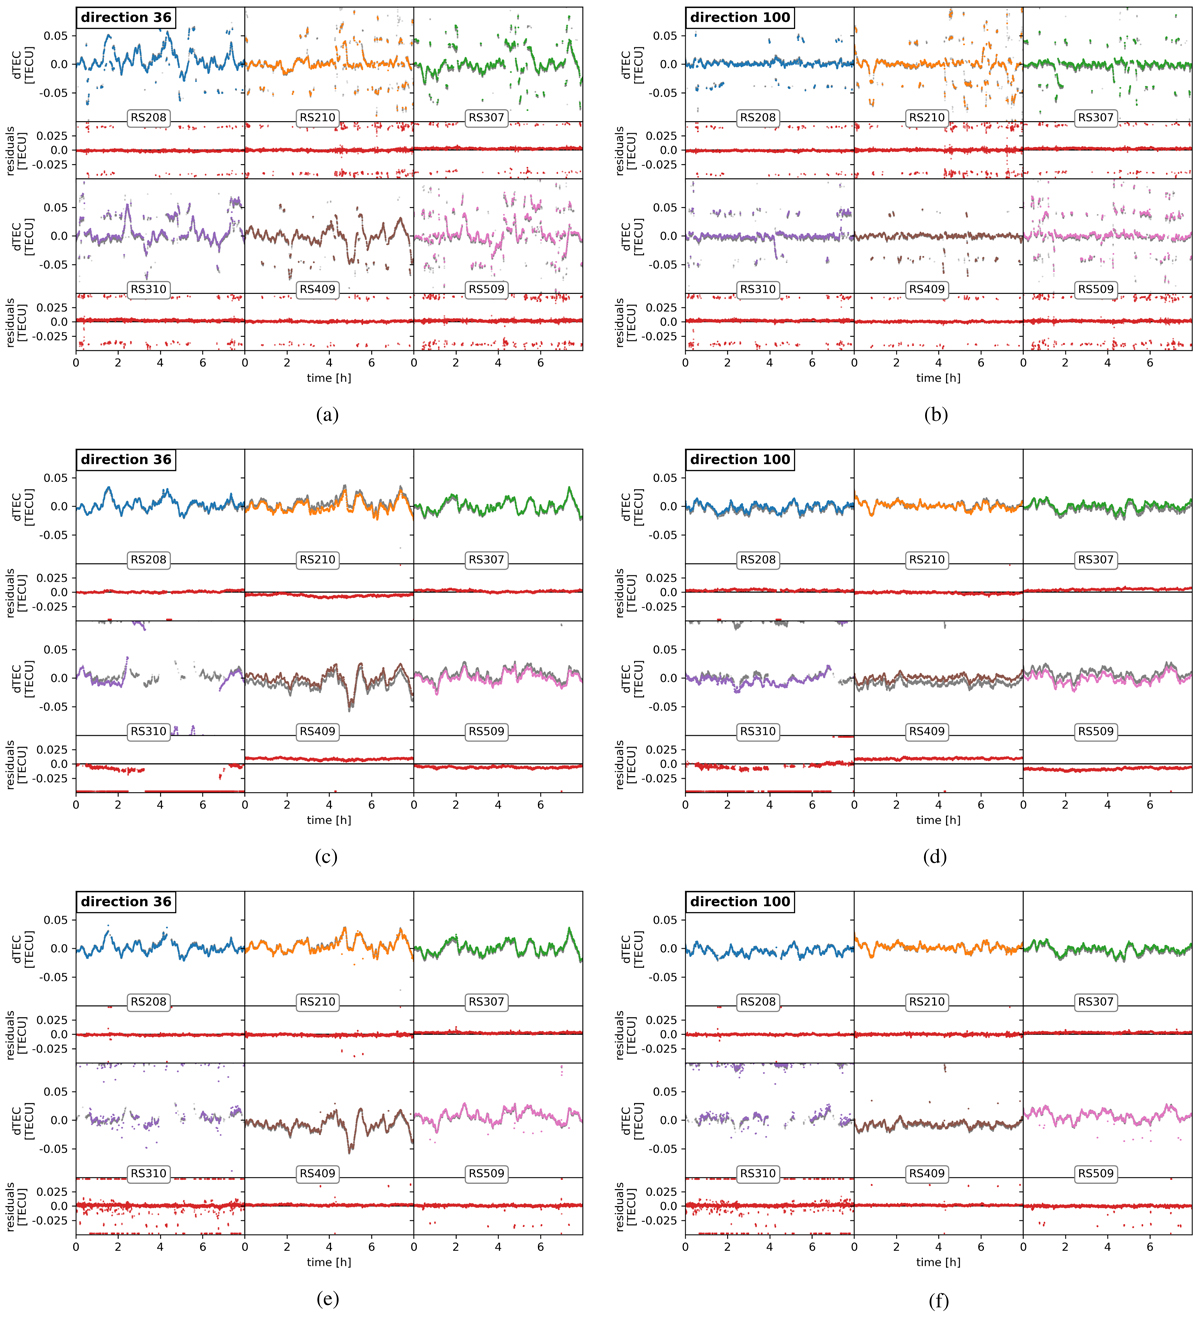
Direction-dependent TEC-solutions (colors except red) and residuals with respect to the simulation input (red) shown in each of the six panels a–f for six distant RS. Residuals outside of the displayed range are indicated by arrows. Panels a, c, and e: in the left column show solutions towards dir36, whereas panels b, d, and f: in the right column show solutions towards dir100. In the two figures a and b in the top row, only LBA phase solutions were used to extract the dTEC, while for the center row c, d, only HBA was considered. The figures e and f in the bottom row show joint calibration solutions derived from LBA and HBA combined. The gray lines in the background of the dTEC panels show the difference between input dTEC and direction-independent dTEC solutions for this station and direction, these values were used to calculate the residuals as dTECresidual = dTECDDE − (dTECinput − dTECDIE). All values are referenced to CS001LBA and CS001HBA0, respectively.
Current usage metrics show cumulative count of Article Views (full-text article views including HTML views, PDF and ePub downloads, according to the available data) and Abstracts Views on Vision4Press platform.
Data correspond to usage on the plateform after 2015. The current usage metrics is available 48-96 hours after online publication and is updated daily on week days.
Initial download of the metrics may take a while.