Fig. 1.
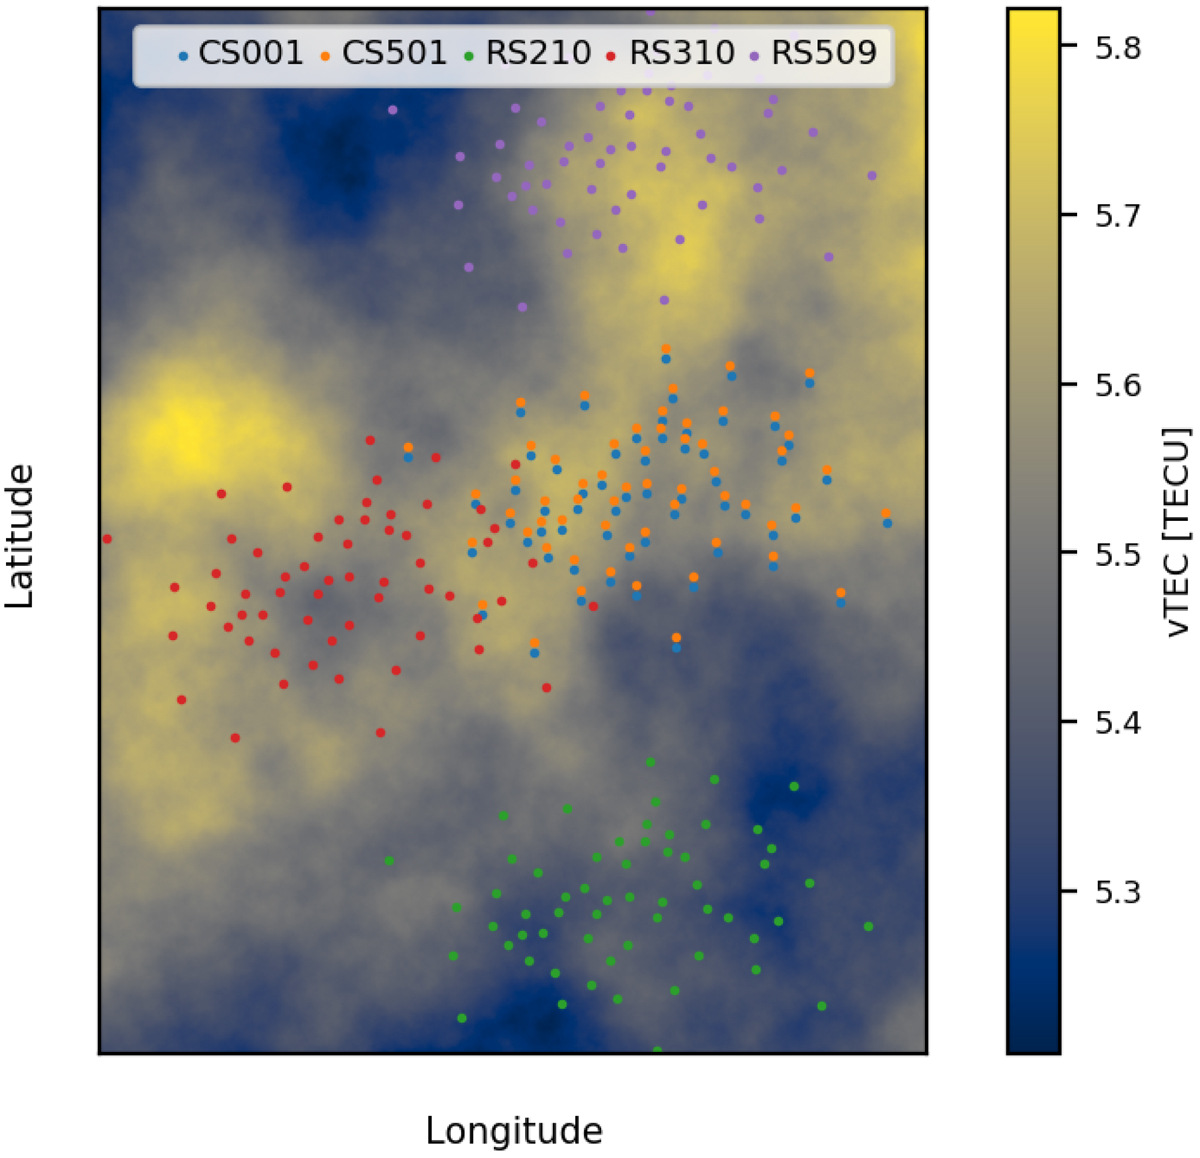
Snapshot of a simulated turbulent TEC-screen with the parameters β = 3.89 and hiono = 250 km. Each circle marks one pierce-point, circles of the same color show pierce-points for different directions belonging to the same station. Only pierce-points belonging to one of the centermost stations (CS001), the most distant central station (CS501) as well as the three outermost remote stations (RS210, RS310, RS509) are displayed.
Current usage metrics show cumulative count of Article Views (full-text article views including HTML views, PDF and ePub downloads, according to the available data) and Abstracts Views on Vision4Press platform.
Data correspond to usage on the plateform after 2015. The current usage metrics is available 48-96 hours after online publication and is updated daily on week days.
Initial download of the metrics may take a while.