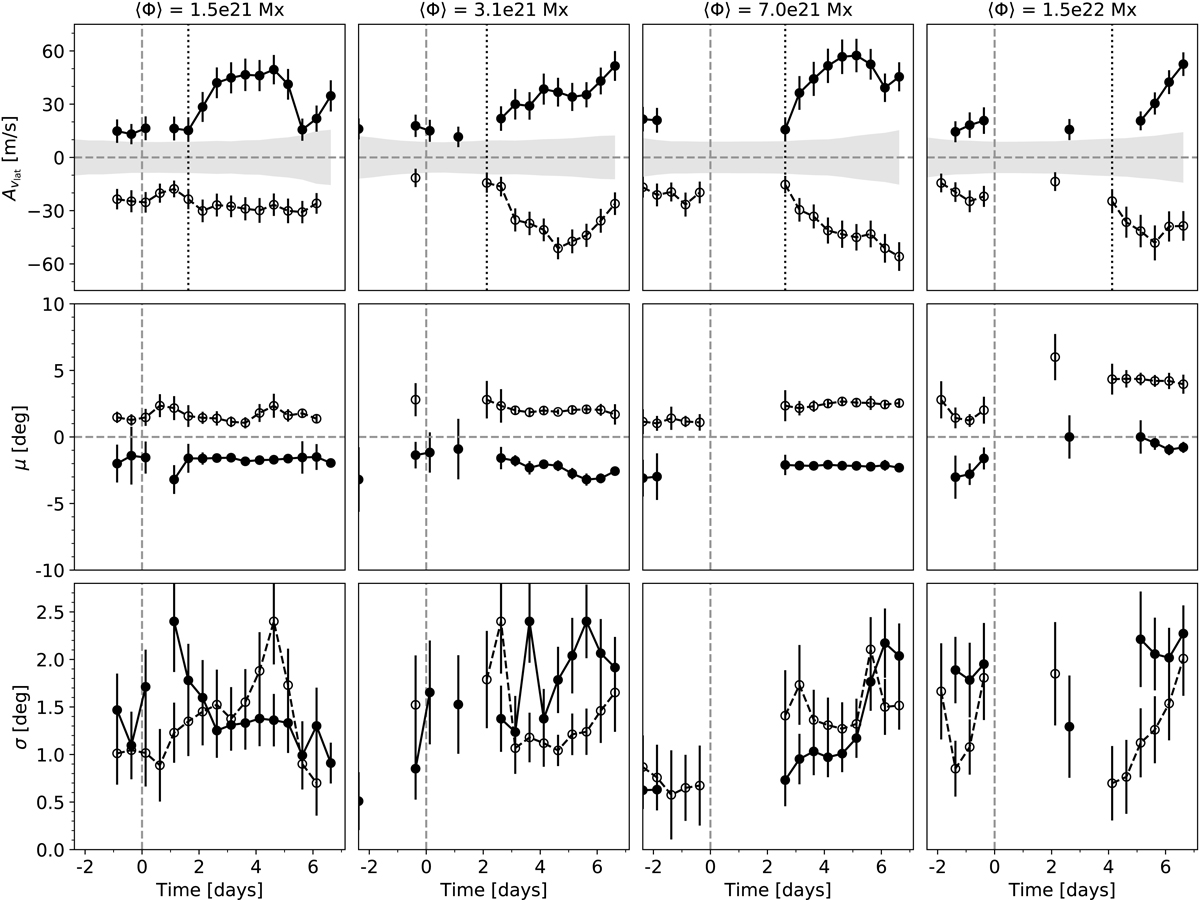
Fig. 7.
Download original image
Parameters of the best-fit Gaussians to the longitudinally averaged latitudinal flow (see Fig. 6). The top row shows the amplitudes A+ and A−, the middle row shows the peak positions μ+ and μ−, and the bottom row shows the standard deviations σ+ and σ− of the model fits (cf. Fig. 6). The four columns show the averages over different ranges of flux, with flux increasing from left to right. The error bars are Monte Carlo estimates using quiet-Sun control regions as background noise. No model was fit when there were no inflow signatures above the noise level (see text). The filled dots (circles) and solid (dashed) lines indicate poleward (equatorward) velocity. The dotted black lines indicate the onset time of the latitudinal flow for each subsample. The gray shaded region indicates the rms in the quiet-Sun control regions.
Current usage metrics show cumulative count of Article Views (full-text article views including HTML views, PDF and ePub downloads, according to the available data) and Abstracts Views on Vision4Press platform.
Data correspond to usage on the plateform after 2015. The current usage metrics is available 48-96 hours after online publication and is updated daily on week days.
Initial download of the metrics may take a while.