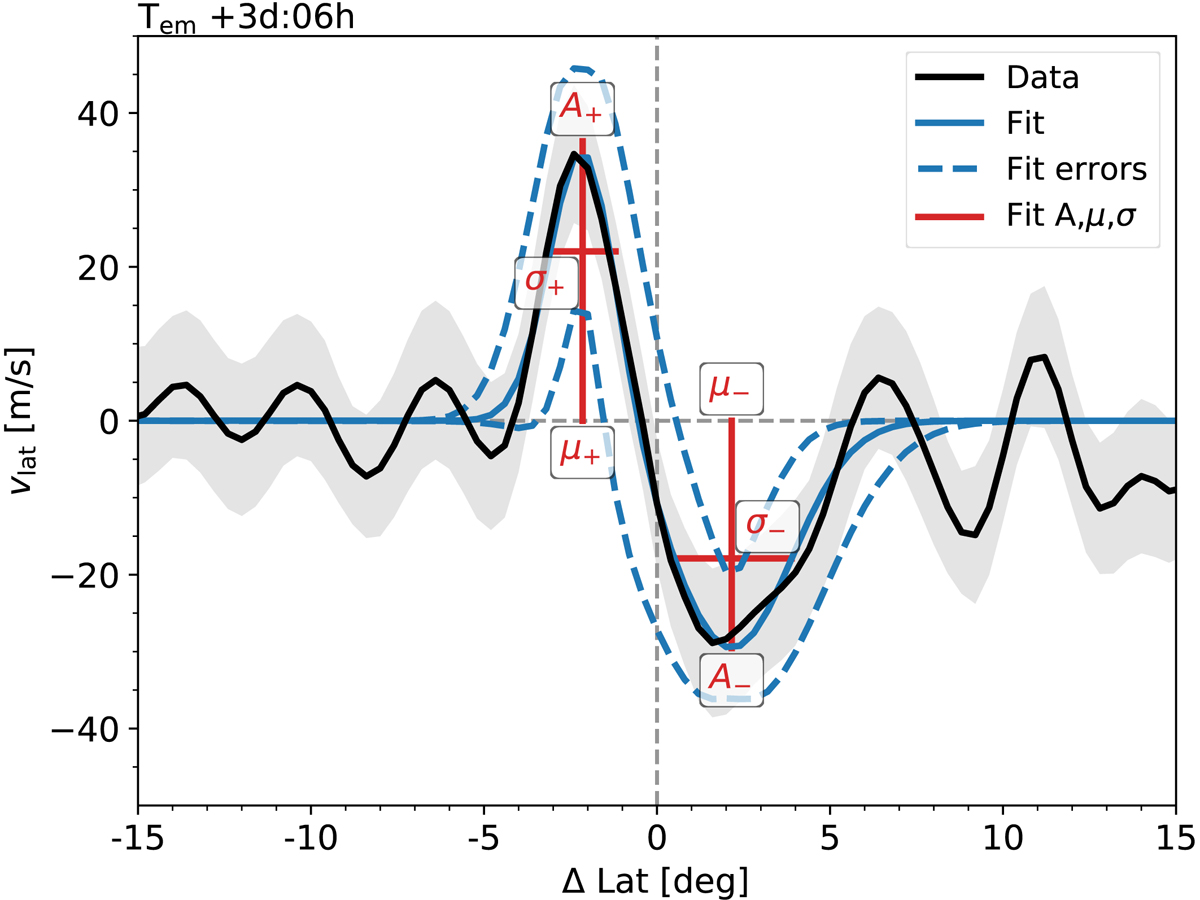
Fig. 6.
Download original image
Data and model fit of a time step of the second-highest flux subsample (⟨Φ⟩=7.0 × 10²¹ Mx). The black line shows the latitudinal flow, averaged over longitudes in the range indicated in Fig. 4. The solid blue line shows the model fit of two Gaussians with opposite polarity (see text for details). The dashed blue lines show the 1σ error estimates of the fit. The red markings indicate the fit parameters of the amplitude A (in m s−1), the peak position μ (relative to the center of the active region along latitude, Δ Lat), and the standard deviation σ (in degree) of the two Gaussians. The gray shaded region indicates the rms of the flow data. The fit parameters of the two Gaussians slightly deviate from the fitted curve due to superposition; this is small compared to the error, however.
Current usage metrics show cumulative count of Article Views (full-text article views including HTML views, PDF and ePub downloads, according to the available data) and Abstracts Views on Vision4Press platform.
Data correspond to usage on the plateform after 2015. The current usage metrics is available 48-96 hours after online publication and is updated daily on week days.
Initial download of the metrics may take a while.