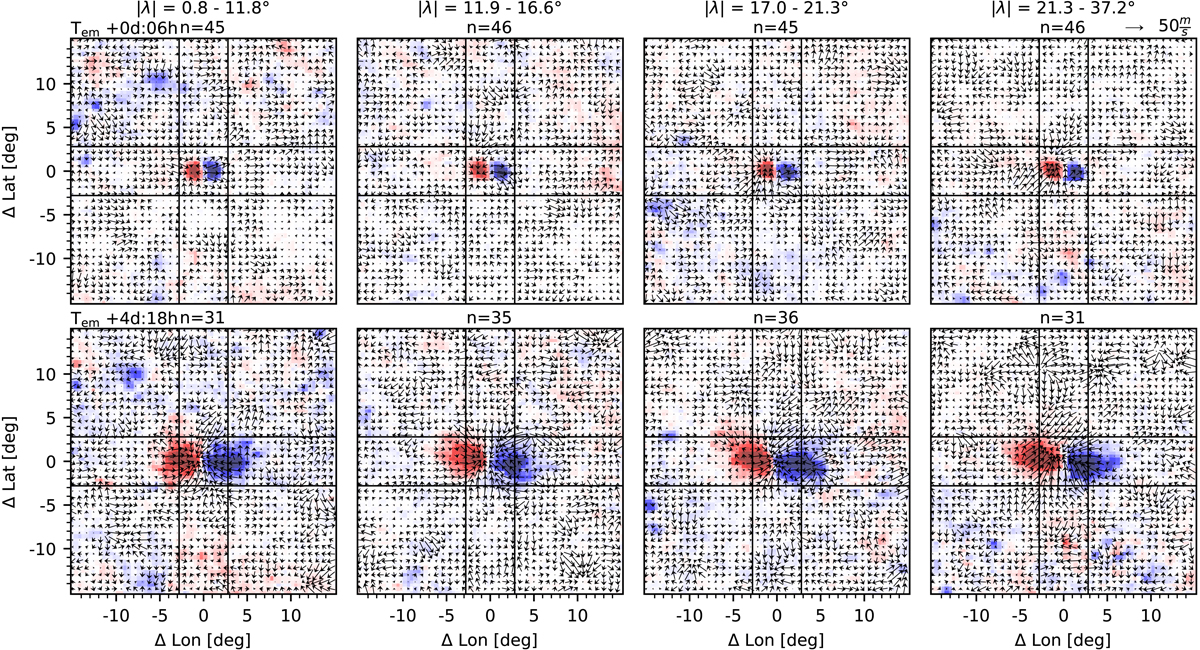
Fig. 5.
Download original image
Evolution (from top to bottom) of the averaged active region magnetic field and flows for the four subsample averages of unsigned latitude |λ| (with |λ| increasing from left to right, cf. right panel of Fig. 3). The labels, color scales, and arrow scales are the same as in Fig. 4. The diverging flow in the bottom row of the third subsample is due to a strong moat flow in AR 11158, which is the largest AR in this subsample at this time.
Current usage metrics show cumulative count of Article Views (full-text article views including HTML views, PDF and ePub downloads, according to the available data) and Abstracts Views on Vision4Press platform.
Data correspond to usage on the plateform after 2015. The current usage metrics is available 48-96 hours after online publication and is updated daily on week days.
Initial download of the metrics may take a while.