Open Access
Fig. 3.
Download original image
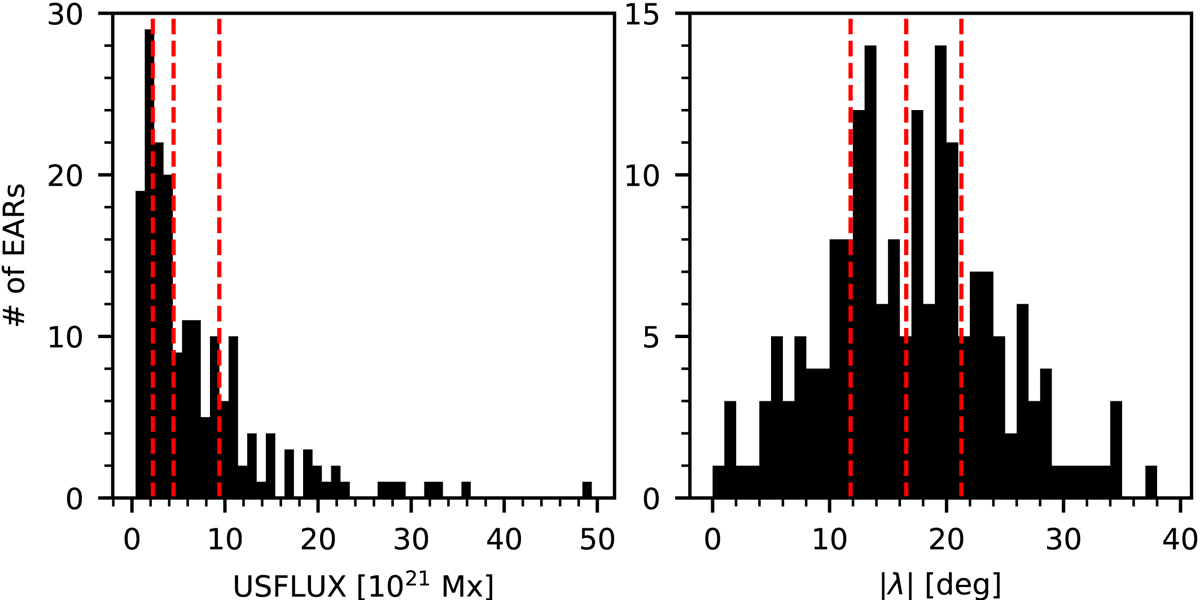
Distributions of the sample of EARs with respect to the unsigned magnetic flux (USFLUX, left panel) and the unsigned latitude |λ| (right panel). The dotted red lines in the two panels separate the distributions into four subsamples, each containing 45 or 46 active regions, sorted by USFLUX and by |λ|, respectively.
Current usage metrics show cumulative count of Article Views (full-text article views including HTML views, PDF and ePub downloads, according to the available data) and Abstracts Views on Vision4Press platform.
Data correspond to usage on the plateform after 2015. The current usage metrics is available 48-96 hours after online publication and is updated daily on week days.
Initial download of the metrics may take a while.