Fig. 2.
Download original image
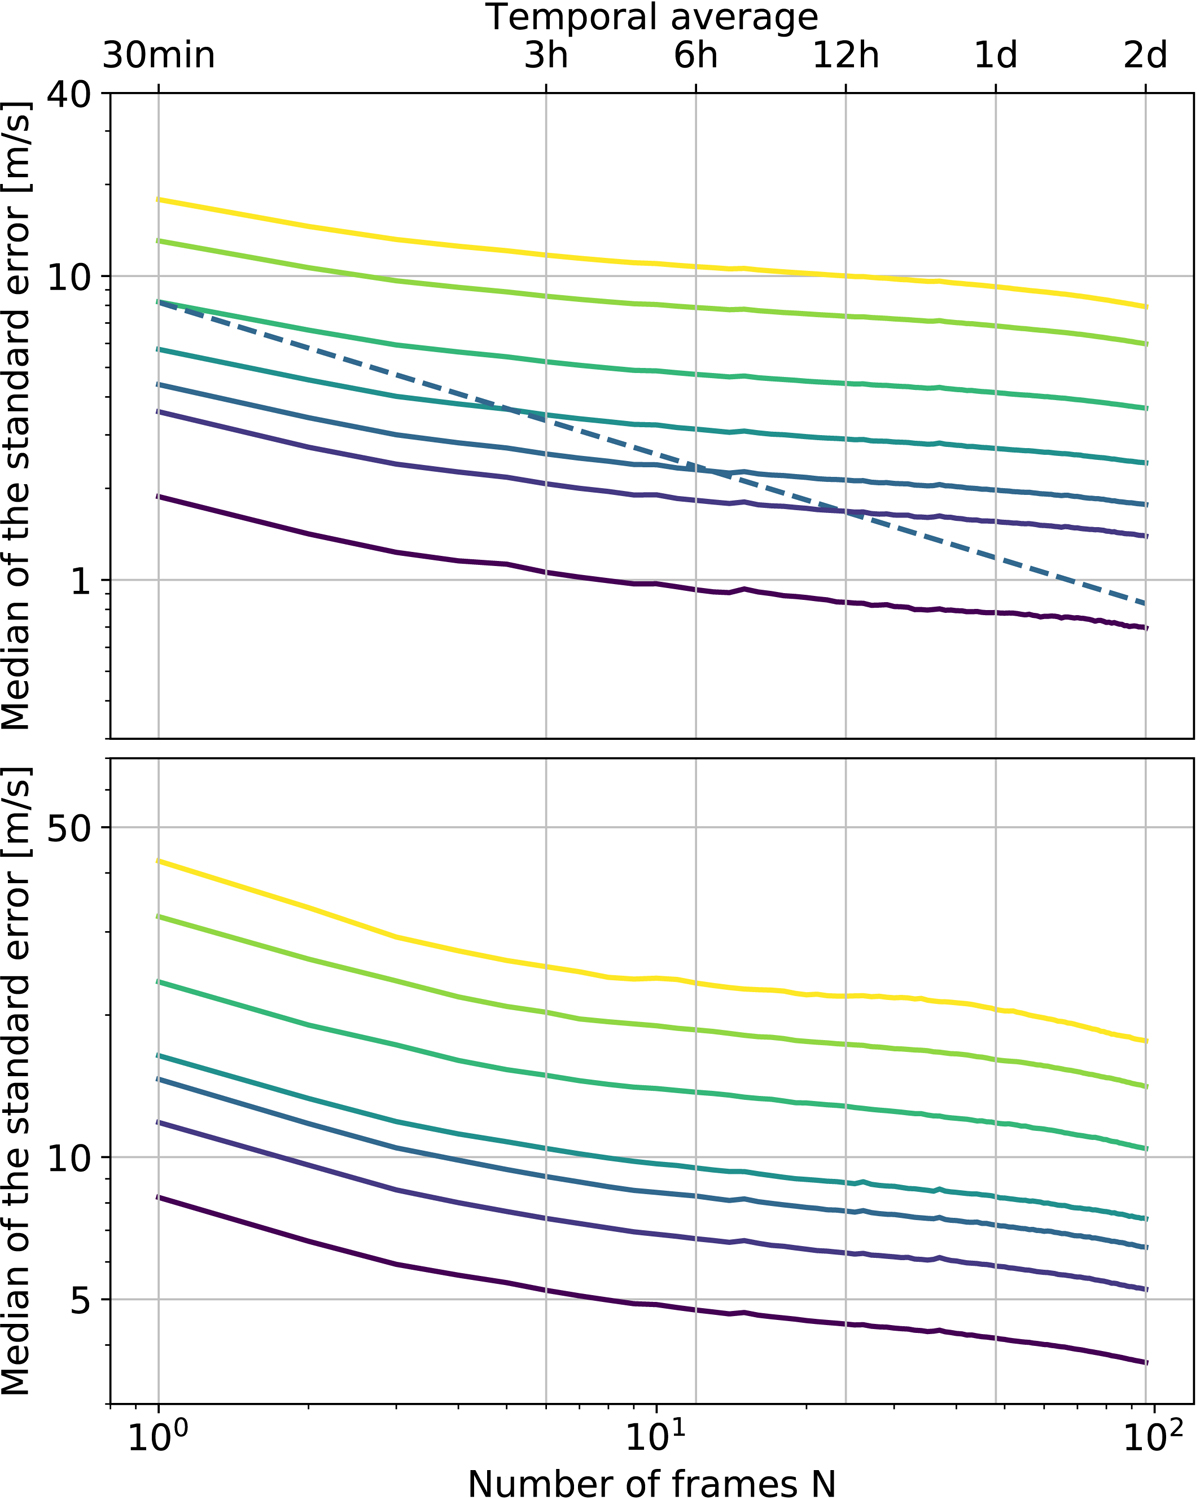
Median of the standard error against averaging time. The lines in the top panel show the cases of no smoothing (yellow) and of Gaussian smoothing of 0.4, 0.8, 1.2, 1.6, 2.0, and 4.0° (green to purple). All lines are from an ensemble average over all 182 ARs. The dotted line shows the ![]() least-squares fit to the case of Gaussian smoothing of σ = 1.6°. Bottom: Same as in the top panel for averages over 5, 10, 20, 45, 60, 91, and 182 control regions (yellow to purple). All lines are with a Gaussian smoothing of σ = 0.8°. Both panels show the case of the latitudinal flow component. The scale of the y-axis is different in the two panels.
least-squares fit to the case of Gaussian smoothing of σ = 1.6°. Bottom: Same as in the top panel for averages over 5, 10, 20, 45, 60, 91, and 182 control regions (yellow to purple). All lines are with a Gaussian smoothing of σ = 0.8°. Both panels show the case of the latitudinal flow component. The scale of the y-axis is different in the two panels.
Current usage metrics show cumulative count of Article Views (full-text article views including HTML views, PDF and ePub downloads, according to the available data) and Abstracts Views on Vision4Press platform.
Data correspond to usage on the plateform after 2015. The current usage metrics is available 48-96 hours after online publication and is updated daily on week days.
Initial download of the metrics may take a while.