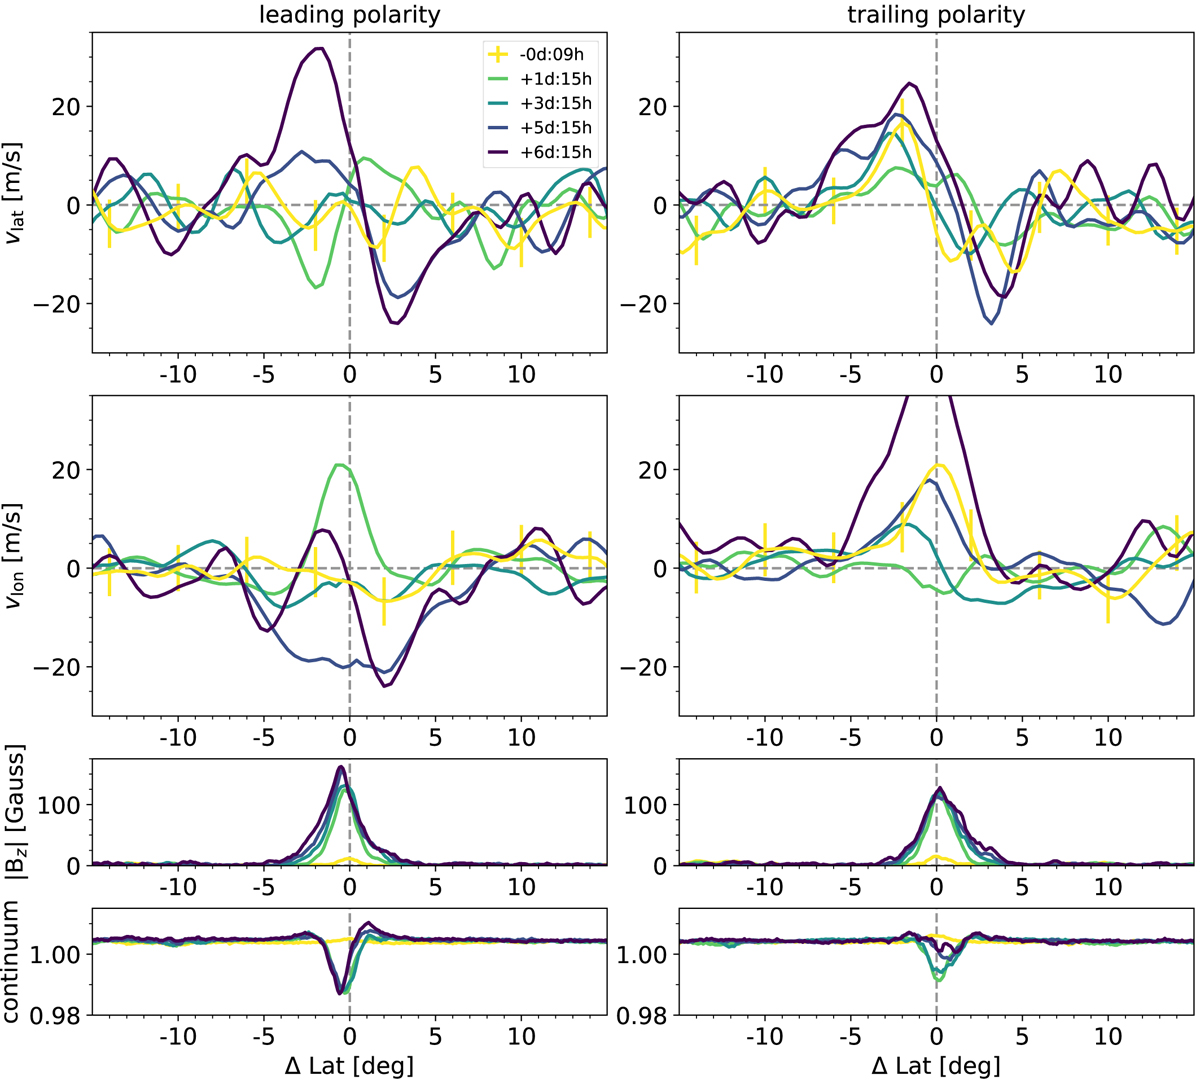
Fig. E.2.
Download original image
Evolution of the flow in a longitudinal band of 6° width for each polarity. Left (right) column: leading (trailing) polarity. First (second) row: latitudinal (longitudinal) flow component, and the third row shows the absolute value of the radial magnetic field. The fourth row shows the normalized continuum intensity. All data are time-averaged over six hours. The flows are smoothed with a Gaussian of σ = 0.8°. The curves represent different time steps (see legend).
Current usage metrics show cumulative count of Article Views (full-text article views including HTML views, PDF and ePub downloads, according to the available data) and Abstracts Views on Vision4Press platform.
Data correspond to usage on the plateform after 2015. The current usage metrics is available 48-96 hours after online publication and is updated daily on week days.
Initial download of the metrics may take a while.