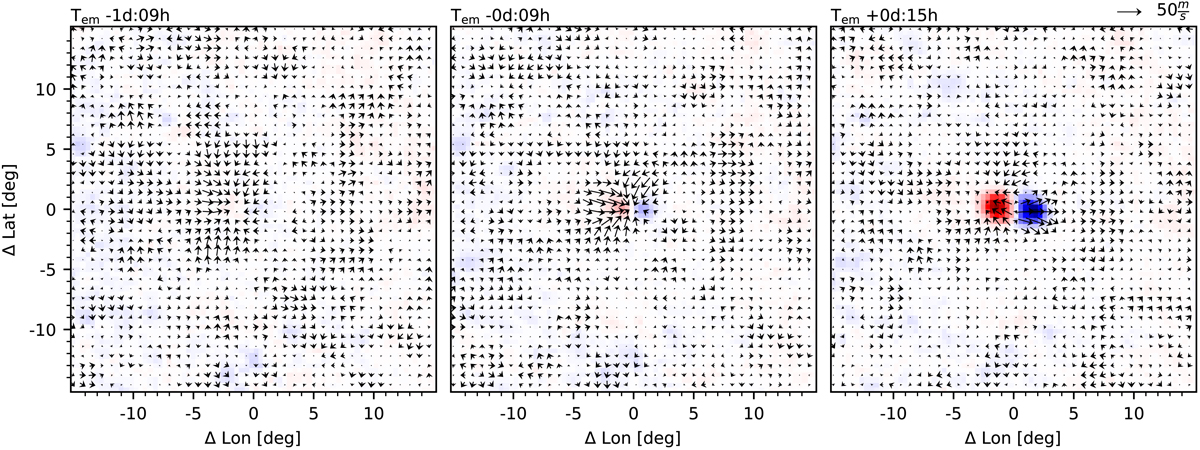
Fig. E.1.
Download original image
Evolution (from left to right) during the emergence phase of the average active region for the ensemble average over all 182 ARs in the sample. Each time step is an average over six hours, centered on the labeled time. The flows are smoothed with a Gaussian of σ = 0.8°. Red (blue) indicates positive (negative) radial magnetic field, saturated at ±300 Gauss.
Current usage metrics show cumulative count of Article Views (full-text article views including HTML views, PDF and ePub downloads, according to the available data) and Abstracts Views on Vision4Press platform.
Data correspond to usage on the plateform after 2015. The current usage metrics is available 48-96 hours after online publication and is updated daily on week days.
Initial download of the metrics may take a while.