Fig. D.2.
Download original image
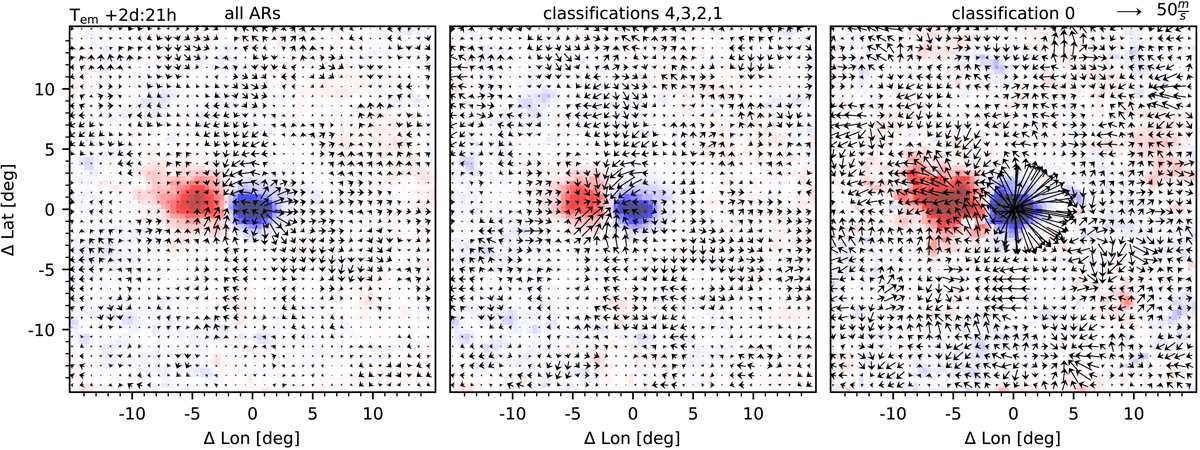
Six hour average flow maps, centered at 2 d and 21 h after emergence. The left panel shows the average of 161 active regions, the middle panel shows the average over 119 active regions with no or only partial sunspot presence, and the right panel shows the average over 42 active regions with a sunspot with clear penumbra (corresponding to classification 0, see text). The active regions are averaged relative to the position of their leading polarity. Red (blue) indicates positive (negative) radial magnetic field saturated at ±150 Gauss. The arrows indicate the flows.
Current usage metrics show cumulative count of Article Views (full-text article views including HTML views, PDF and ePub downloads, according to the available data) and Abstracts Views on Vision4Press platform.
Data correspond to usage on the plateform after 2015. The current usage metrics is available 48-96 hours after online publication and is updated daily on week days.
Initial download of the metrics may take a while.