Fig. D.1.
Download original image
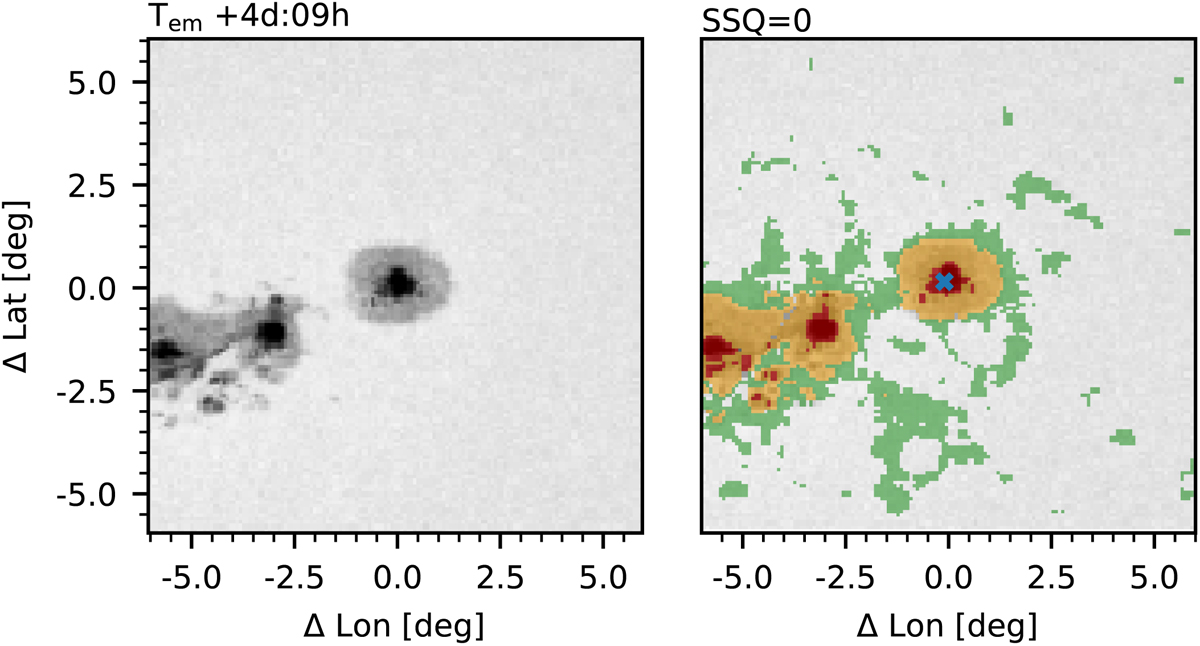
Example of the sunspot classification. Left: normalized six-hour average continuum map of AR 11158. The axis labels are relative to the center of the leading polarity, as defined in Sect. 3.2. Right: same as left, with a colored overlay of pixels for which |Bz| is higher than 10 Gauss. Colors indicate no intensity darkening (green), penumbra (yellow), and umbra (red; see text for definition). The blue cross indicates the center of the largest umbral region. The time step shown here has the sunspot classification SSQ = 0.
Current usage metrics show cumulative count of Article Views (full-text article views including HTML views, PDF and ePub downloads, according to the available data) and Abstracts Views on Vision4Press platform.
Data correspond to usage on the plateform after 2015. The current usage metrics is available 48-96 hours after online publication and is updated daily on week days.
Initial download of the metrics may take a while.