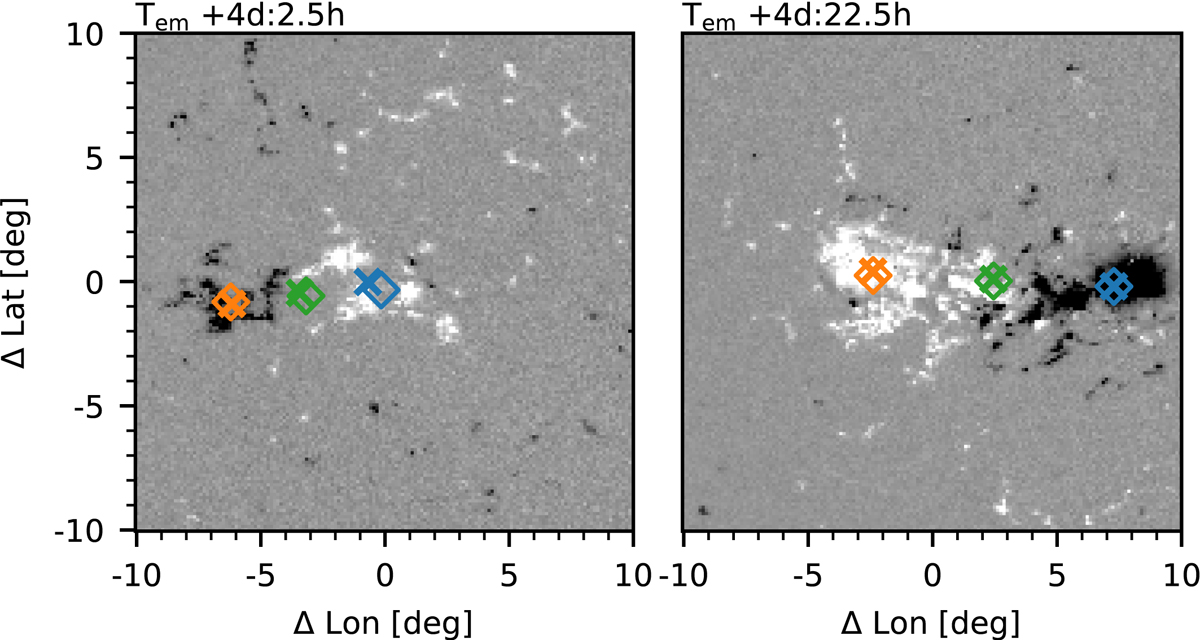
Fig. C.1.
Download original image
Comparisons of the two position-finding methods on AR 11310 (left) and AR 11640 (right). The blue, orange, and green symbols mark the position of the leading and trailing polarity and the center of the AR, respectively. The crosses and diamonds refer to coordinates derived with the method described in Sect. 3.2 and the method described by Schunker et al. (2019), respectively. The axis labels are relative coordinates provided by the HEAR survey. The background images show the radial field Bz. The gray scale saturates at ±500 Gauss.
Current usage metrics show cumulative count of Article Views (full-text article views including HTML views, PDF and ePub downloads, according to the available data) and Abstracts Views on Vision4Press platform.
Data correspond to usage on the plateform after 2015. The current usage metrics is available 48-96 hours after online publication and is updated daily on week days.
Initial download of the metrics may take a while.