Open Access
Fig. 3.
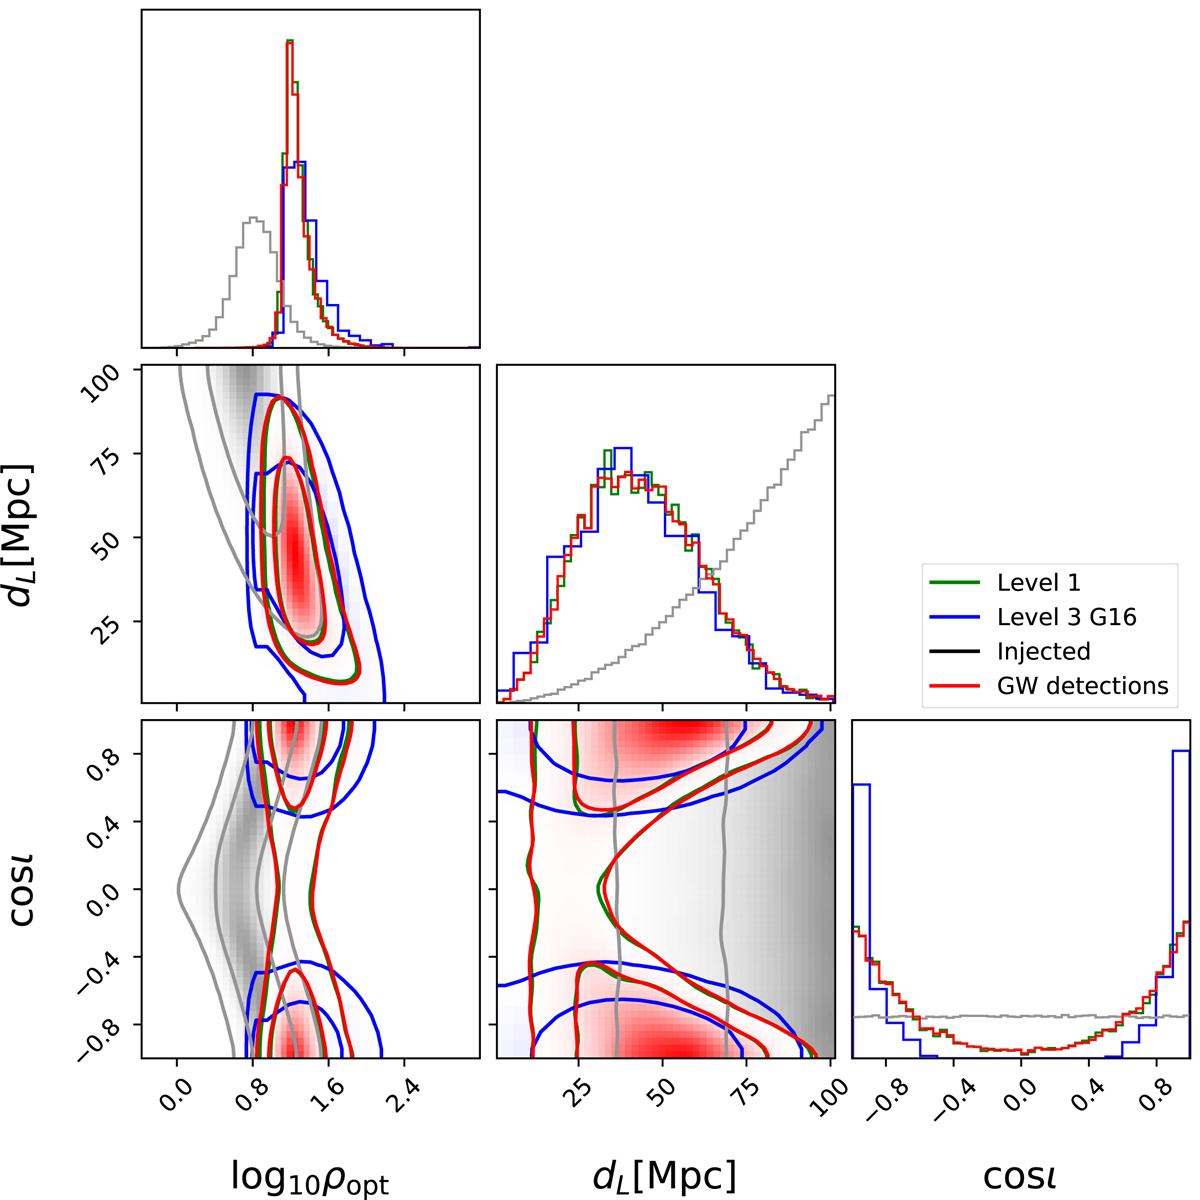
Histograms for the distributions of inclination angle ι, luminosity distance dL and optimal-filter GW signal-to-noise ratio (see Eq. (1)) for all simulated BNS mergers (black line), those detected with GW only (red), and those detected with Level 1 (green line) or Level 3 (blue line) for an O2-type run.
Current usage metrics show cumulative count of Article Views (full-text article views including HTML views, PDF and ePub downloads, according to the available data) and Abstracts Views on Vision4Press platform.
Data correspond to usage on the plateform after 2015. The current usage metrics is available 48-96 hours after online publication and is updated daily on week days.
Initial download of the metrics may take a while.